
Whole genome alignments, Demo
Demo: Whole-genome alignments
Alignments in the Region in Detail view
Let’s look at some of the comparative genomics views in the Location tab. Go to the region 6B:291753000-291966000 in Triticum aestivum (wheat). We can look at individual species comparative genomics tracks in this view by clicking on Configure this page.
Select BLASTz/LASTz alignments from the left-hand menu to choose alignments between closely related species. Turn on the alignments for Triticum dicoccoides (wild emmer), Triticum turgidum (domesticated emmer wheat) and Triticum urartu (red wild einkorn wheat).
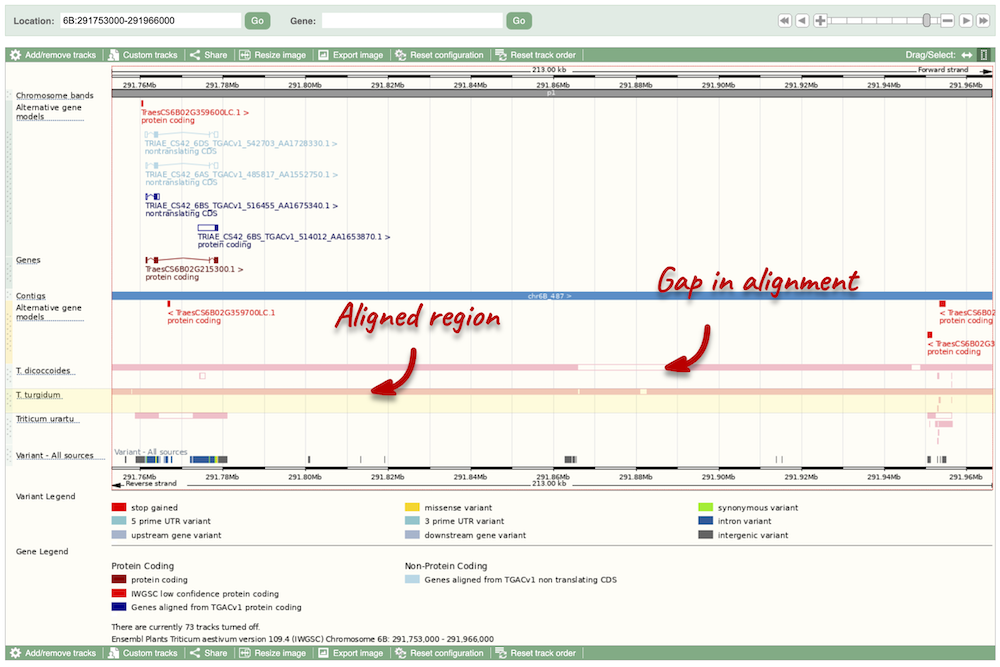
The alignment is greatest between closely related species. We can see that T. turgidum has the most similar sequence to T. aestivum, followed by T. dicoccoides, and T. urartu has the largest gaps in the alignment.
Sequence alignments
We can also look at the alignment between species or groups of species as text. Click on Comparative Genomics: Alignments (text) in the left-hand menu.
Click on Select an alignment to open the alignment menu. Select T. turgidum from the alignments list then click Go.
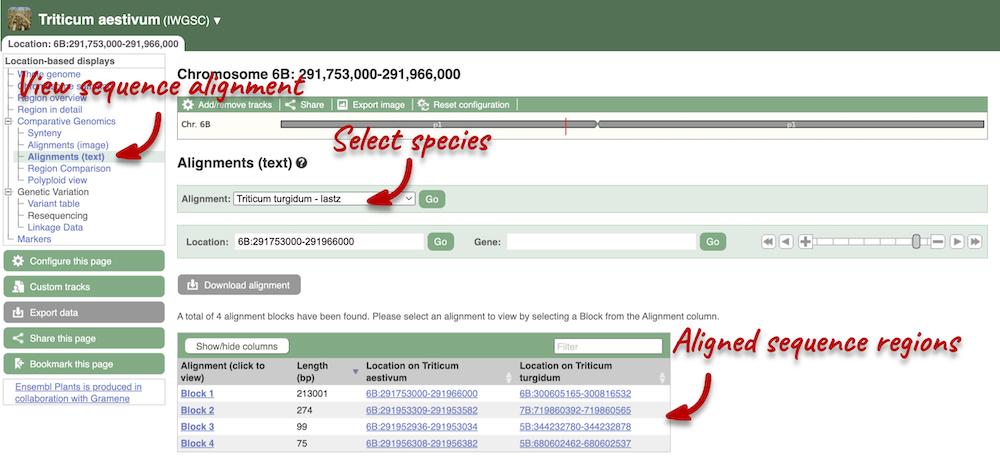
In this case there are 4 blocks aligned of different lengths, some of which correspond to the region we saw unaligned in the image. Click on Block 1.
You will see a list of the regions aligned, followed by the sequence alignment. Click on Display full alignment. Exons are shown in red (you may need to scroll down the page to see the first exon).
Region comparison
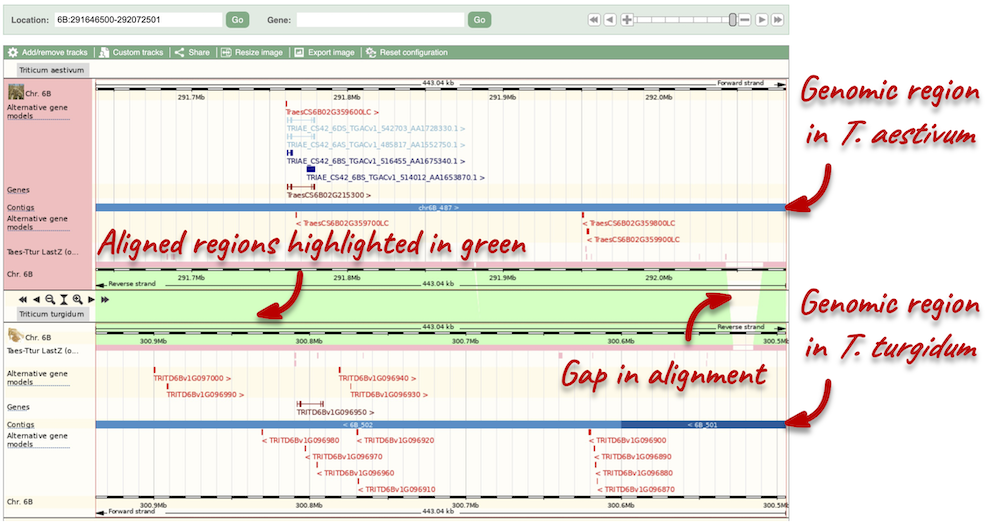
To compare with both contigs visually, go to Comparative Genomics: Region Comparison.
To add species to this view, click on the green Select species or regions button. Choose T. turgidum again then close the menu.
Polyploid view
For polyploids, a Polyploid view will be available for you to compare homologous chromosomes. Genomes for each chromosome are displayed graphically in the lower panel. Your reference chromosome is shown in the first panel. Orange bars show aligned regions between the homologous chromosomes. Aligned regions are also connected and highlighted in green.
Synteny
We can view large-scale syntenic regions from our chromosome of interest. Click on Comparative Genomics: Synteny in the left-hand menu and select T. turgidum* from the **Change species drop-down in the right-hand side.

Black linking lines indicate sequences are oriented in the same directed, red linking lines indicate the sequences are inverted.


