
Annotating genetic variants with the VEP, Demo
We have identified five variants on human chromosome nine, C-> A at 128203516, an A deletion at 128328461, C->A at 128322349, C->G at 128323079 and G->A at 128322917.
We will use the Ensembl VEP to determine:
- Have my variants already been annotated in Ensembl?
- What genes are affected by my variants?
- Do any of my variants affect gene regulation?
Go to the front page of Ensembl and click on the Variant Effect Predictor.
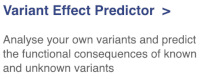
This page contains information about the VEP, including links to download the script version of the tool. Click on Launch VEP to open the input form:
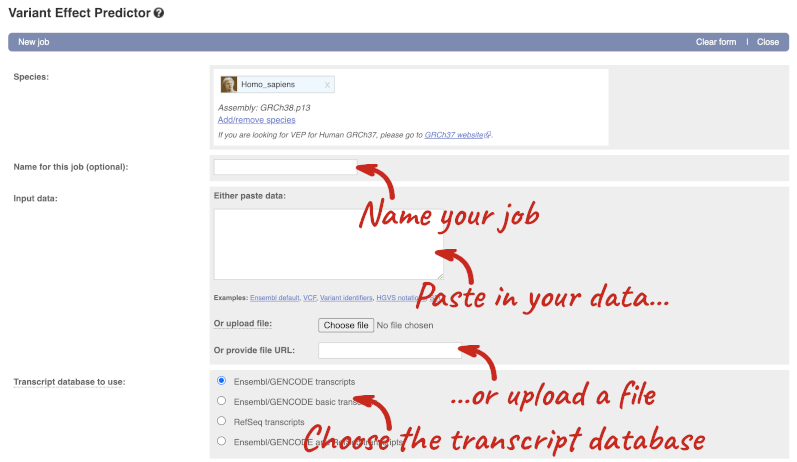
The data is in VCF format:
chromosome coordinate id reference alternative
Put the following into the Paste data box:
9 128328460 var1 TA T
9 128322349 var2 C A
9 128323079 var3 C G
9 128322917 var4 G A
9 128203516 var5 C A
The VEP will automatically detect that the data is in VCF.
There are further options that you can choose for your output. These are categorised as Identifiers, Variants and frequency data, Additional annotations, Predictions, Filtering options and Advanced options. Let’s open all the menus and take a look.
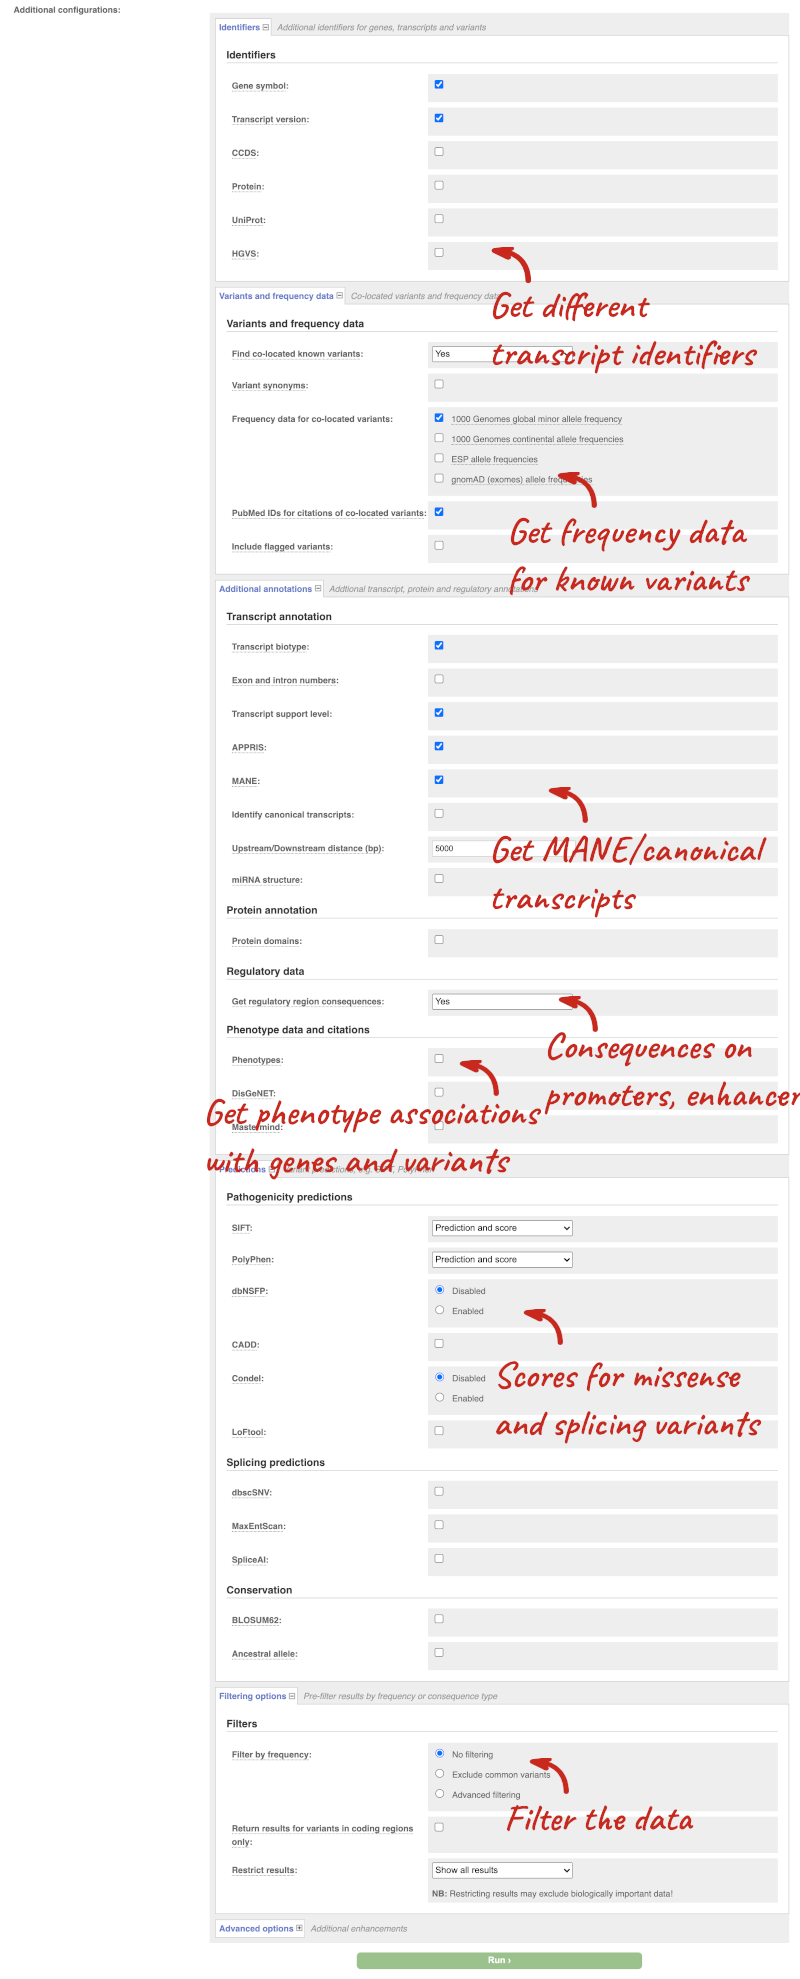
Hover over the options to see definitions.
We’re going to select some options:
- HGVS, annotation of variants in terms of the transcripts and proteins they affect, commonly-used by the clinical community
- Phenotypes
- Protein domains
When you’ve selected everything you need, scroll right to the bottom and click Run.
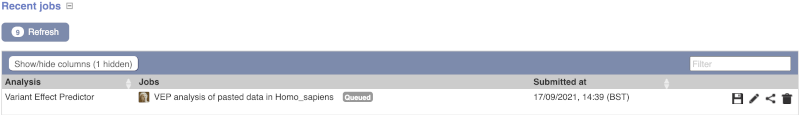
The display will show you the status of your job. It will say Queued, then automatically switch to Done when the job is done, you do not need to refresh the page. You can edit or discard your job at this time. If you have submitted multiple jobs, they will all appear here.
Click View results once your job is done.
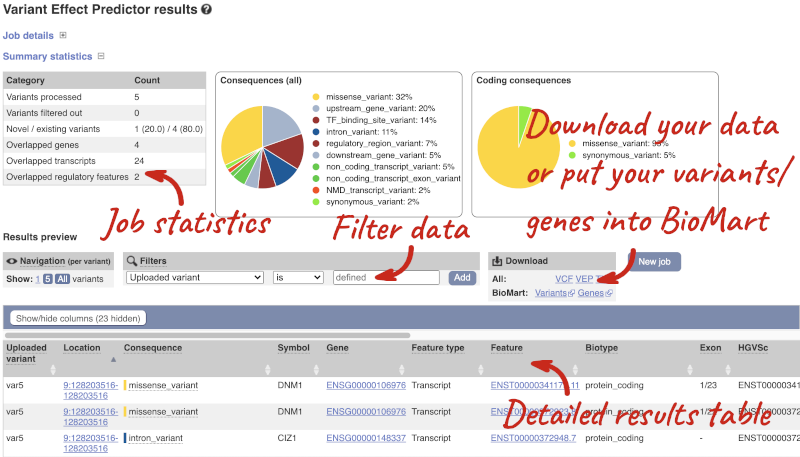
In your results you will see a graphical summary of your data, as well as a table of your results.
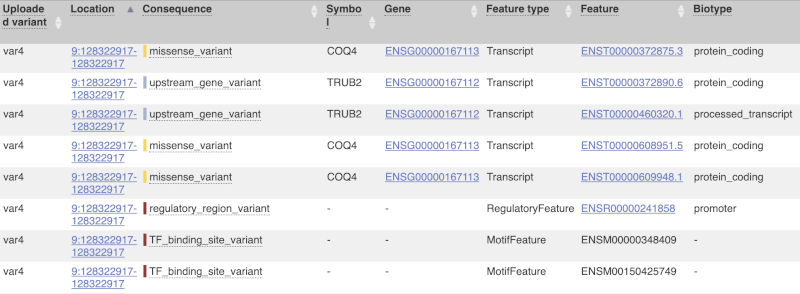
The results table is enormous and detailed, so we’re going to go through the it by section. The first column is Uploaded variant. If your input data contains IDs, like ours does, the ID is listed here. If your input data is only loci, this column will contain the locus and alleles of the variant. You’ll notice that the variants are not neccessarily in the order they were in in your input. You’ll also see that there are multiple lines in the table for each variant, with each line representing one transcript or other feature the variant affects.
You can mouse over any column name to get a definition of what is shown.
The next few columns give the information about the feature the variant affects, including the consequence. Where the feature is a transcript, you will see the gene symbol and stable ID and the transcript stable ID and biotype. Where the feature is a regulatory feature, you will get the stable ID and type. For a transcription factor binding motif (labelled as a MotifFeature) you will see just the ID. Most of the IDs are links to take you to the gene, transcript or regulatory feature homepage.
This is followed by details on the effects on transcripts, including the position of the variant in terms of the exon number, cDNA, CDS and protein, the amino acid and codon change, transcript flags, such as MANE, on the transcript, which can be used to choose a single transcript for variant reporting, and predicted pathogenicity scores. The predicted pathogenicity scores are shown as numbers with coloured highlights to indicate the prediction, and you can mouse-over the scores to get the prediction in words. Two options that we selected in the input form are the HGVS notation, which is shown to the left of the image below and can be used for reporting, and the Domains to the right. The Domains list the proteins domains found, and where there is available, provide a link to the 3D protein model which will launch a LiteMol viewer, highlighting the variant position.
![]()
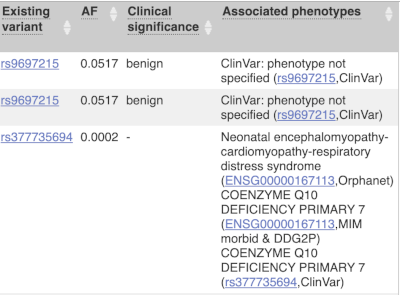
Where the variant is known, the ID of the existing variant is listed, with a link out to the variant homepage. In this example, only rsIDs from dbSNP are shown, but sometimes you will see IDs from other sources such as COSMIC. The VEP also looks up the variant from frequency files, and pulls back the allele frequency (AF in the table), which will give you the 1000 Genomes Global Allele Frequency. In our query, we have not selected allele frequencies from the continental 1000 Genomes populations or from gnomAD, but these could also be shown here. We can also see ClinVar clinical significance and the phenotypes associated with known variants or with the genes affected by the variants, with the variant ID listed for variant associations and the gene ID listed for gene associations, along with the source of the association.
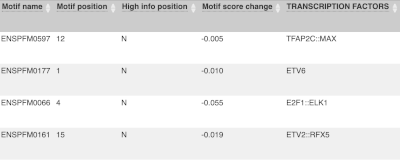
For variants that affect transcription factor binding motifs, there are columns that show the effect on motifs (you may need to click on Show/hide columns at the top left of the table to display these). Here you can see the position of the variant in the motif, if the change increases or decreases the binding affinity of the motif and the transcription factors that bind the motif.
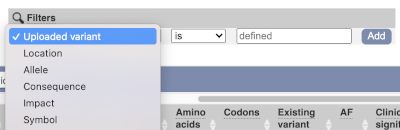
Above the table is the Filter option, which allows you to filter by any column in the table. You can select a column from the drop-down, then a logic option from the next drop-down, then type in your filter to the following box. We’ll try a filter of Consequence, followed by is then missense_variant, which will give us only variants that change the amino acid sequence of the protein. You’ll notice that as you type missense_variant, the VEP will make suggestions for an autocomplete.
You can export your VEP results in various formats, including VCF. When you export as VCF, you’ll get all the VEP annotation listed under CSQ in the INFO column. After filtering your data, you’ll see that you have the option to export only the filtered data. You can also drop all the genes you’ve found into the Gene BioMart, or all the known variants into the Variation BioMart to export further information about them.


