
Exploring variants in Ensembl, Demo
In any of the sequence views shown in the Gene and Transcript tabs, you can view variants on the sequence. You can do this by clicking on Configure this page from any of these views.
Let’s take a look at the Gene sequence view for HBB in human. Search for HBB and go to the Sequence view.
If you can’t see variants marked on this view, click on Configure this page and select Show variants: Yes and show links. You may also wish to add a filter to the variants to allow them to load more quickly, we’ll add Filter variants by evidence status: 1000Genomes.
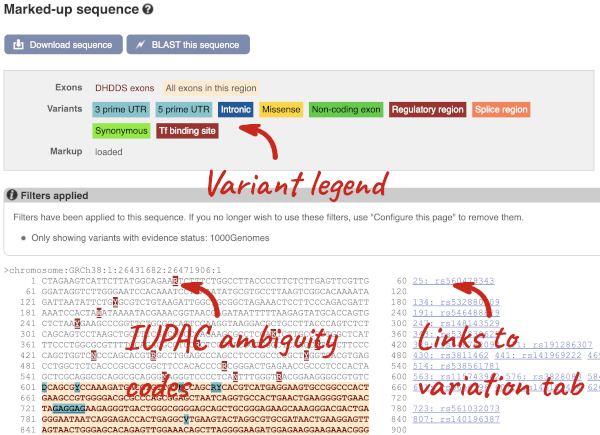
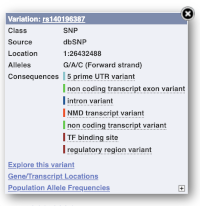
Find out more about a variant by clicking on it.
You can add variants to all other sequence views in the same way.
You can go to the Variation tab by clicking on the variant ID. For now, we’ll explore more ways of finding variants.
To view all the sequence variants in table form, click the Variant table link at the left of the gene tab.
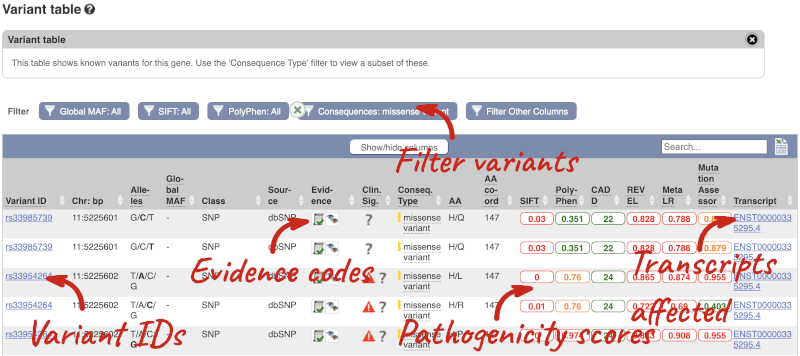
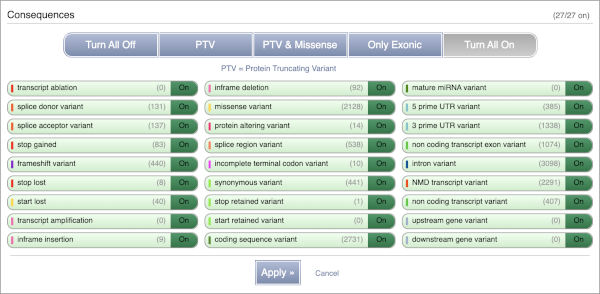
You can filter the table to only show the variants you’re interested in. For example, click on Consequences: All, then select the variant consequences you’re interested in. For display purposes, the table above has already been filtered to only show missense variants.
You can also filter by the different pathogenicity scores and MAF, or click on Filter other columns for filtering by other columns such as Evidence or Class.
The table contains lots of information about the variants. You can click on the IDs here to go to the Variation tab too.
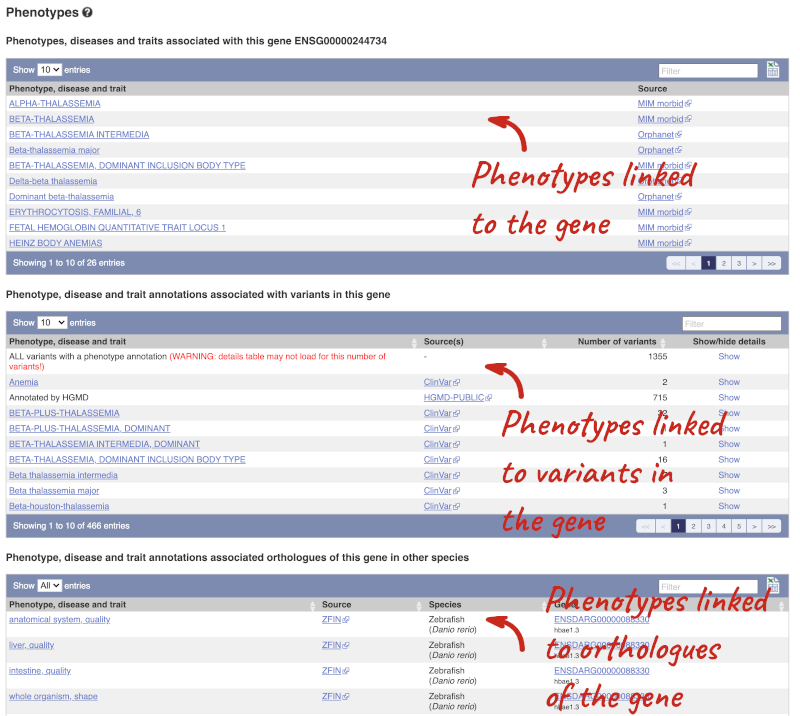
You can also see the phenotypes associated with a gene. Click on Phenotype in the left hand menu.
Open the transcript table and go to HBB-201 ENST00000335295, then click on Haplotypes in the left hand menu.
![]()
The Haplotypes view in the transcript tab shows you the actual protein and CDS sequences in 1000 Genomes individuals. This is possible because the 1000 Genomes study has phased genotypes, so we know which alleles occur on which of the chromosome pairs. The table lists all the versions of the protein that occur along with their frequencies, including the reference sequence and sequences with one or more alternative alleles.
Click on one of the haplotypes, we’ll go for 18K>*,19del{130}, to find out more about it. Here you will see the frequency in the 1000 Genomes subpopulations, the sequence and the 1000 Genomes individuals where this protein is found.
Let’s have a look at variants in the Location tab. Click on the Location tab in the top bar.
Configure this page and open Variation from the left-hand menu.
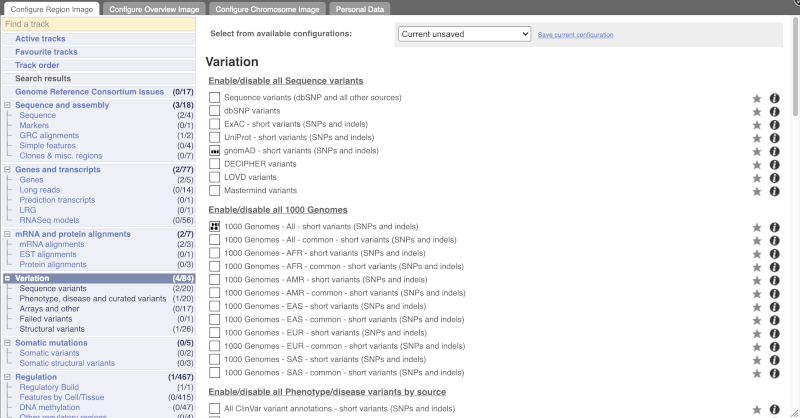
There are various options for turning on variants. You can turn on variants by source, by frequency, presence of a phenotype or by individual genome they were isolated from. You can also turn on genotyping chips.
Let’s have a look at a specific variant. If we zoomed in we could see the variant rs334 in this region, however it’s easier to find if we put rs334 into the search box. Click through to open the Variation tab.
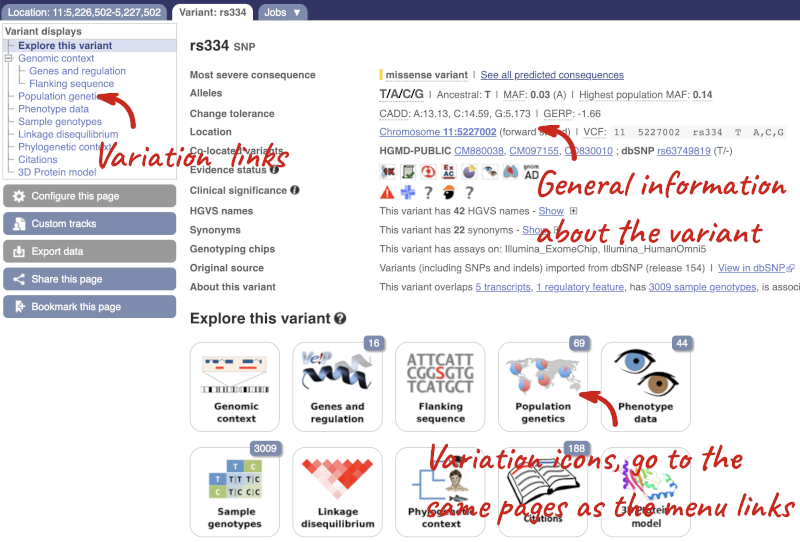
The icons show you what information is available for this variant. Click on Genes and regulation, or follow the link on the left.
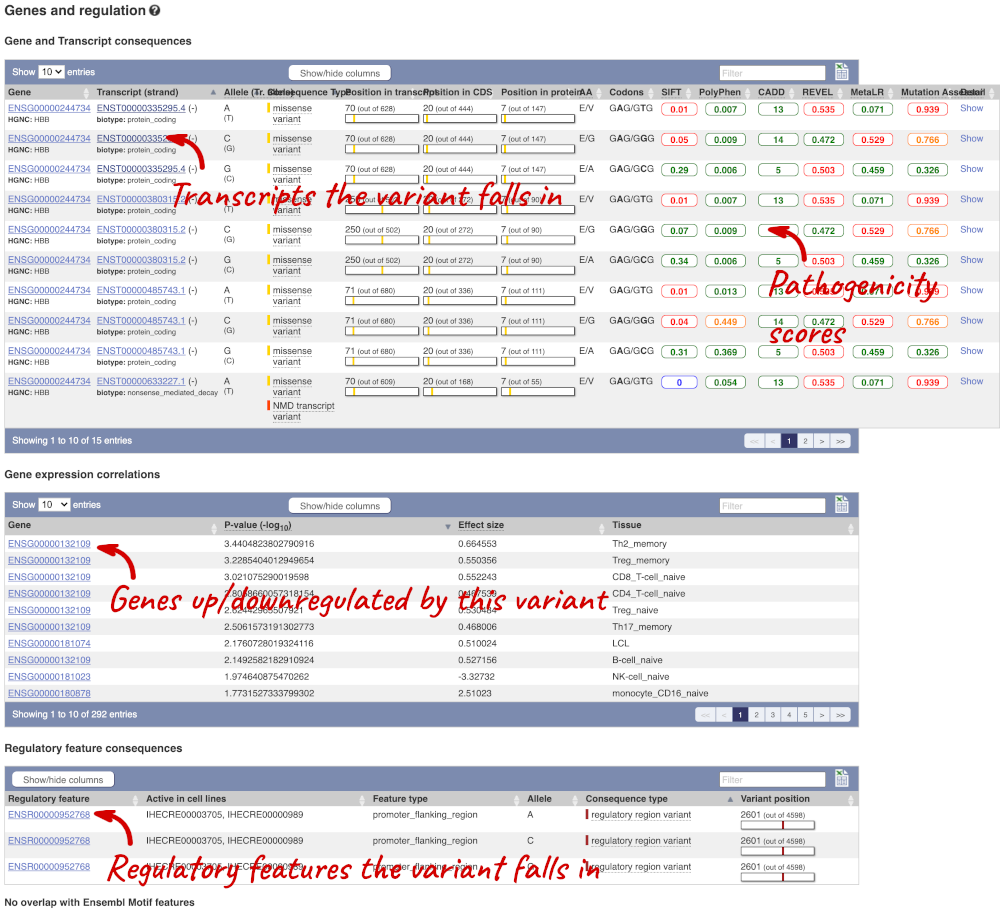
This page illustrates the genes the variant falls within and the consequences on those genes, including pathogenicity predictors. It also shows data from GTEx on genes that have increased/decreased expression in individuals with this variant, in different tissues. Finally, regulatory features and motifs that the variant falls within are shown.
We can also see the variant in the protein structure by clicking on 3D Protein model.
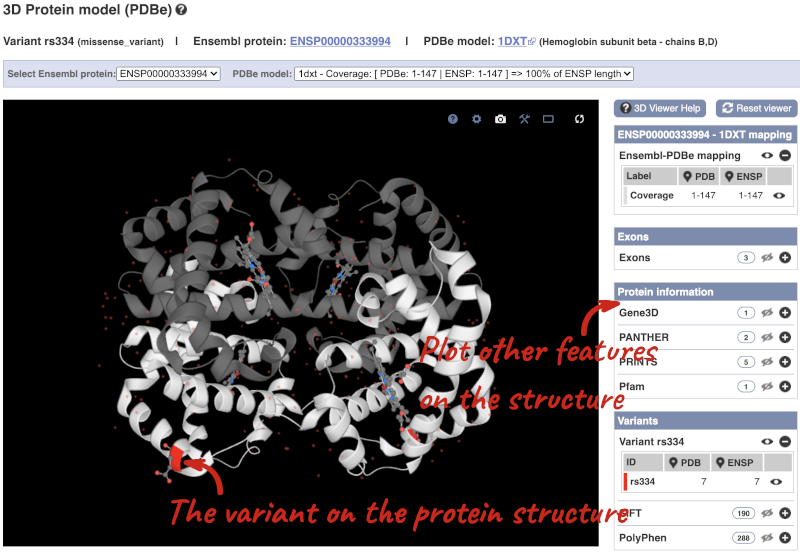
This is a LiteMol viewer, where you can rotate and zoom in on the structure. The variant location is highlighted, so you can see where it lands within the structure.
Let’s look at population genetics. Click on Population genetics in the left-hand menu.
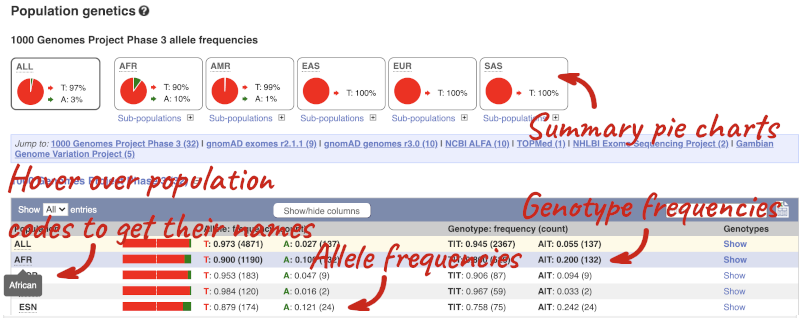
The population allele frequencies are shown by study, including 1000 Genomes and gnomAD. Where genotype frequencies are available, these are shown in the tables.
There are big differences in allele frequencies between populations. Let’s have a look at the phenotypes associated with this variant to see if they are known to be specific to certain human populations. Click on Phenotype Data in the left-hand menu.
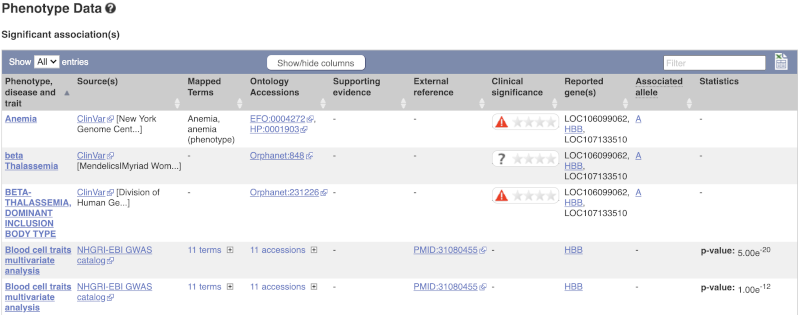
This variant is associated with various phenotypes, including sickle cell and malaria resistance. These phenotype associations come from sources including the GWAS catalog, ClinVar, Orphanet and OMIM. Where available, there are links to the original paper that made the association, the allele that is associated with the phenotype and p-values and other statistics.


