Features that regulate gene expression, Demo
We’re going to look for regulatory features in the region of a gene and investigate their activity in different cell types. We’ll start by searching for the gene KPNA2 and jumping to the Location tab. Scroll down to the Region in detail view and zoom out a little to see the gene as well as its flanking regions.
The Regulatory Build track is shown by default.
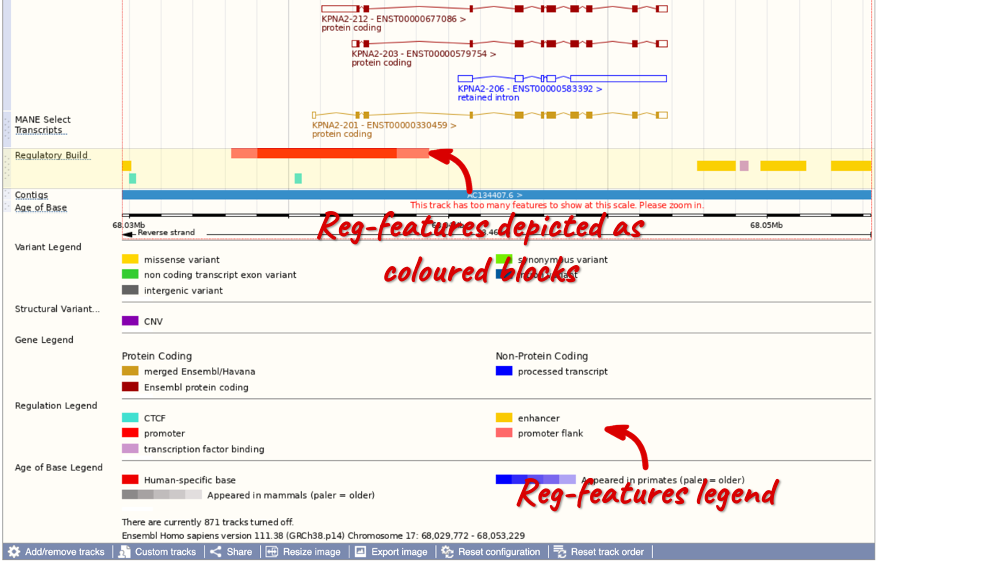
In this region we can see a number of regulatory features, including a red promoter with light red promoter flanks, cyan CTCF binding sites, yellow enhancers and lilac transcription factor (TF) binding sites (don’t worry if you have zoomed out further or not as far and can see more/less). Refer to the legend at the bottom of the view to see what each of the colours mean.
You can also click on the individual regulatory features to learn more. Click on the red promoter to open a pop-up menu.
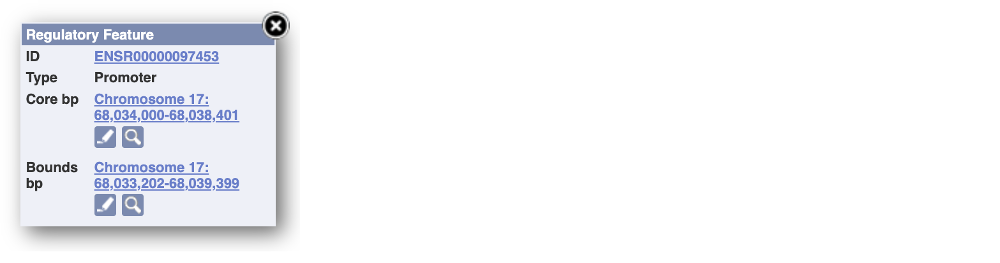
Click on the stable ID, ENSR00000097453, to jump to the Regulation tab.
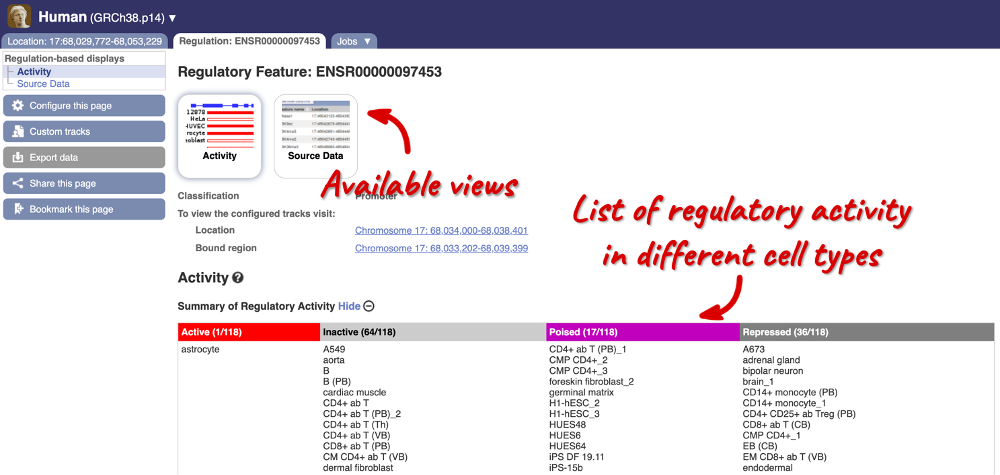
Here, you can find a summary of the activity of the promoter in the different cell types. Scroll down to Summary of Regulatory Aactivity to find out in which cells the promoter is active (the feature displays an active epigenetic signature, which can include evidence of open chromatin), inactive (the region bears no epigenetic modifications from the ones included in the Regulatory Build), poised (the feature displays a epigenetic signature with the potential to be activated) or repressed (the feature is epigenetically suppressed). We can see that this promoter is active in one out of the 118 cell types currently in Ensembl.
Let’s switch back to the Location tab to explore the different regulation tracks that are available. Click on Configure this page and in the pop-up window under the Regulation section, click on Other regulatory regions and enable the Fantom 5, TarBase and Motif features tracks. Close the pop-up window.
The Fantom 5 track displays transcription start site (TSS) and enhancer predictions from the FANTOM5 project.
The TarBase track displays experimentally verified miRNA targets from TarBase.
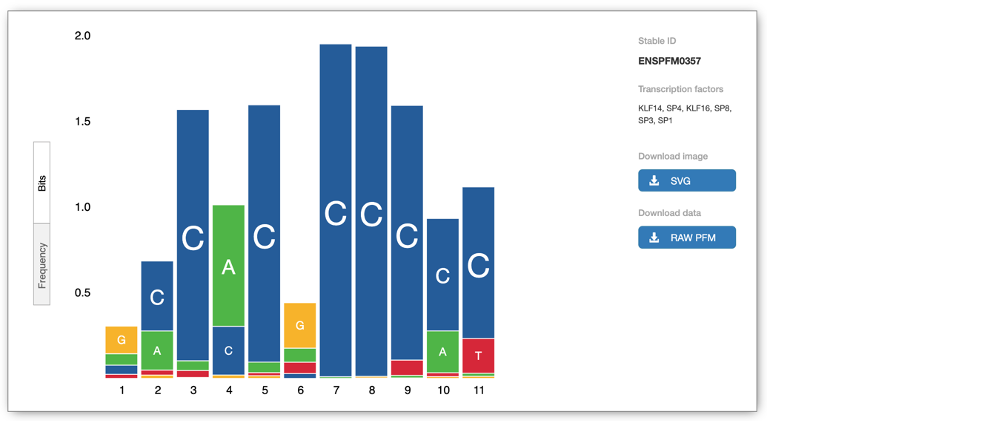
The Motif features track indicates the positions of transcription factor binding motifs (TFBMs) in black lines/blocks. You can click on individual features to find out more information about the TFBM, including a list of TFs binding at this site and, if available, in which cells the TFBM was experimentally verified in. You can also view the Binding matrix** by clicking on the matrix ID. This opens a pop-up window which displays the binding matrix used and a binding score representing how well a particular site matches the binding matrix.
We can explore more detailed data by adding further Regulation tracks. Click on the Configure this page button on the left-hand side.

In the pop-up window, go to Regulation and click on Features by Cell/Tissue to view the detailed activity of the regulatory feature by cell type.
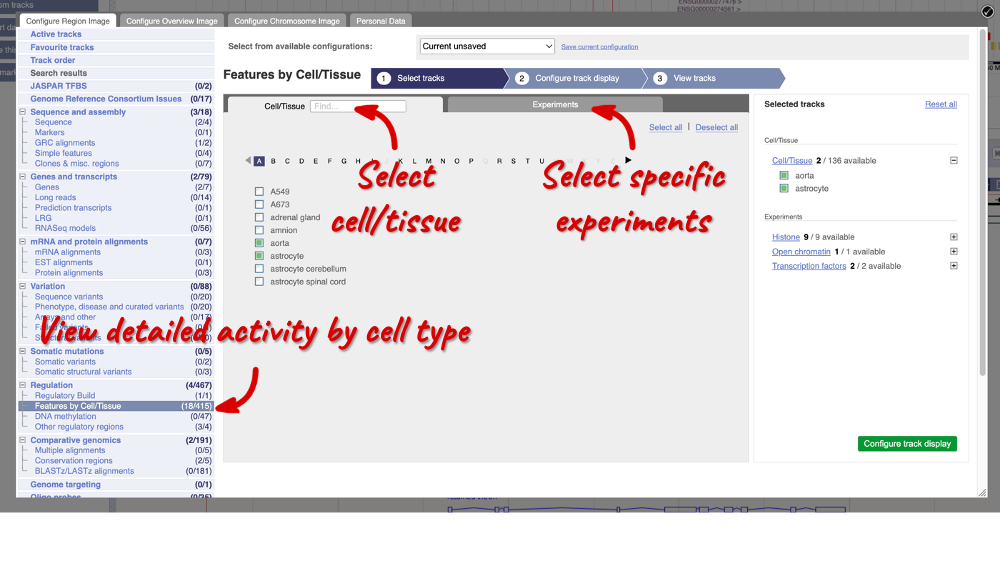
We can add cells by clicking on them. Find them using the search or the alphabet ribbon. Let’s add a cell type where the promoter is inactive, aorta, and one where it’s active astrocytes. Once you’ve selected the cells, they will appear in the menu on the right, where you can easily view the list by clicking on the + icon and de-select them.
To choose the experiments to see data on, click on the Experiments tab at the top of the menu. You can navigate this the same as the Cell/Tissue tab, except that you have to choose between Histone, Open Chromatin and Transcription factors. Let’s Select all in all categories.
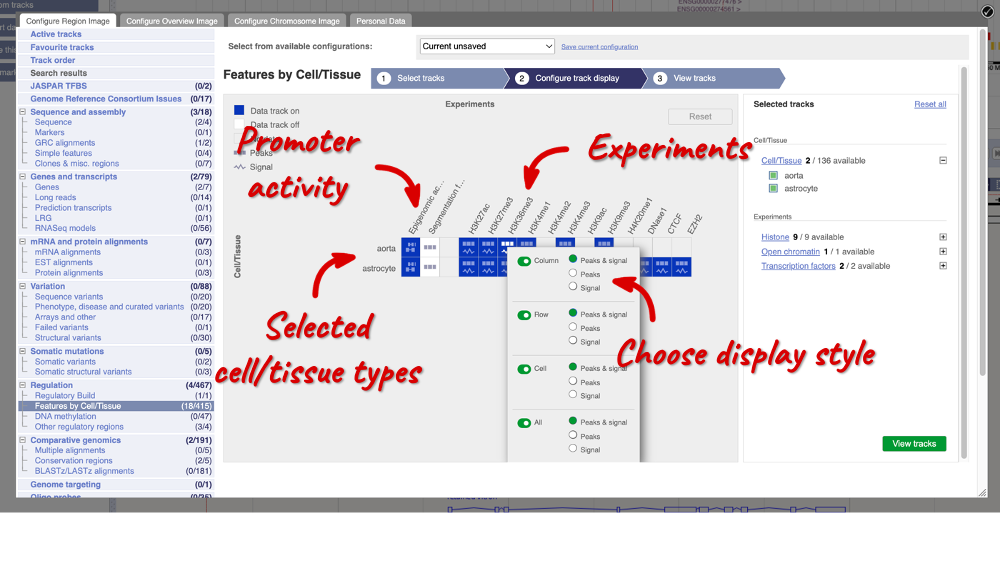
When you’ve chosen your experiments and cells, you can click on the green Configure track display button in the bottom right-hand corner.
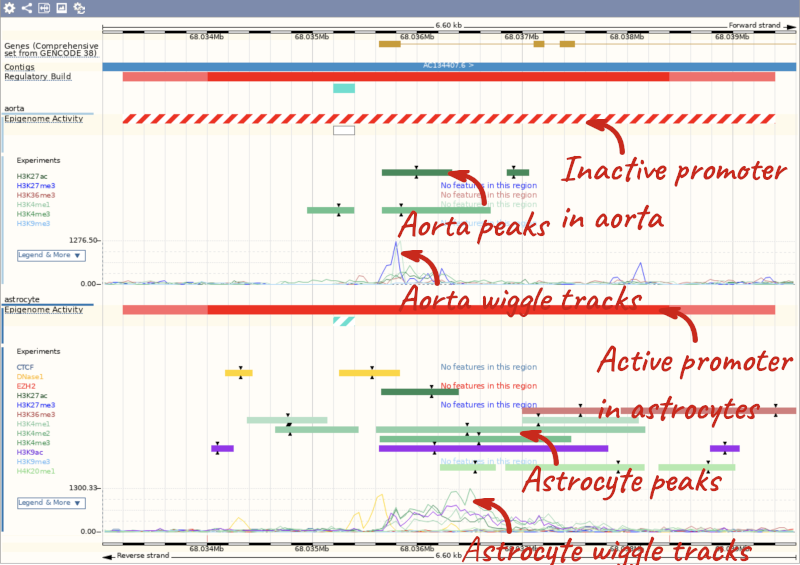
Now we can see the active feature in astrocytes compared to the inactive feature in aorta.