Whole-genome alignments, Demo
Demo: Whole-genome alignments
Alignments in the Region in Detail view
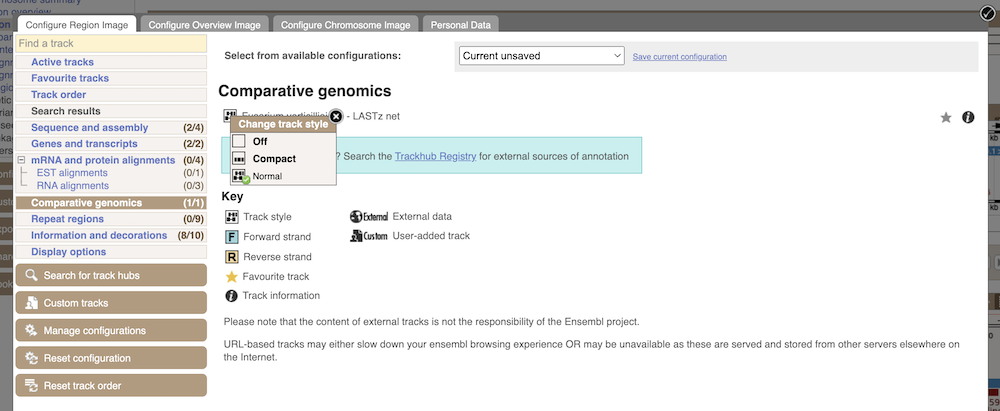
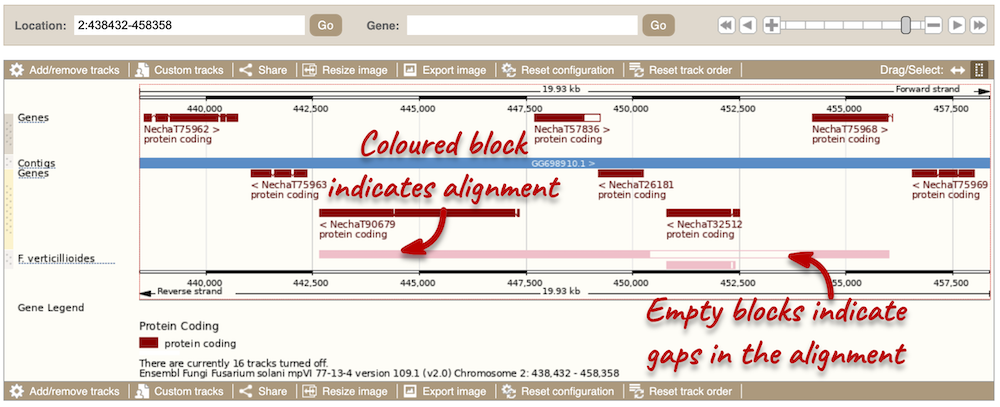
Let’s look at some of the comparative genomics views in the Location tab. Go to the region 2:438432-458358 in Fusarium solani. This region includes a number of genes and we want to find out if any regions align with Fusarium verticillioides. To do this, we need to look at a pairwise alignment between the two Fusarium species. We can look at individual species comparative genomics tracks in this view by clicking on Configure this page. In the Comparative genomics section, turn on the F. verticillioides track in the normal format.
We can now see some pink alignments shown on the display. Alignments to the same chromosome are presented in a single row, and gaps in the alignment are shown by empty blocks. If there are alignments to multiple chromosomes in the aligned species, they are represented on different rows. From the track, we can see that the regions encoding genes NechaG90679, NechaG57836, NechaG26181, NechaG32512 and NechaG75968 align perfectly between the two genomes.
Sequence alignments
We can also look at the sequence alignment between the two species as text. Click on Comparative Genomics: Alignments (text) in the left-hand menu.
Click on Select an alignment to select a species you want to align. Let’s select F. solani and click Go. There are two blocks aligned of different lengths, some of which correspond to the region we just saw in the Region in detail view.
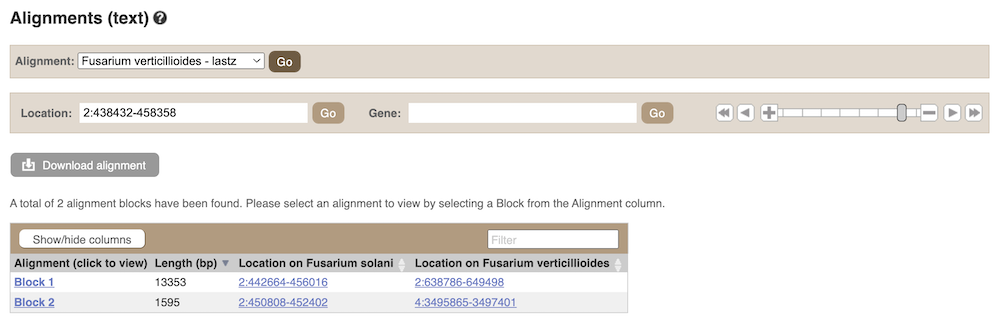
Click on Block 1.
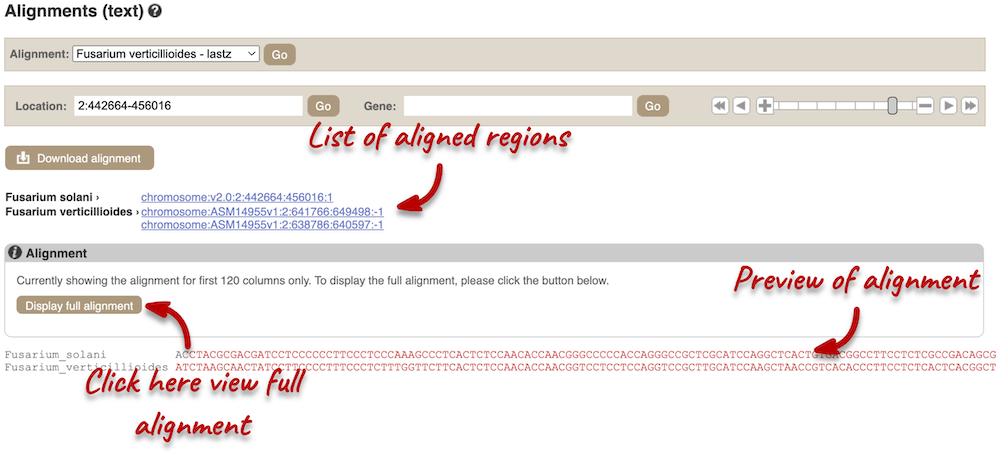
You will see a list of aligned regions, followed by the sequence alignment. Click on Display full alignment. Exons are shown in red. Click on Configure this page on the left. In the pop-up menu, you can turn on the options to view Show conservation regions and Mark alignment start/end. This will add highlights where the sequence matches.
Region comparison
To compare the two genomic regions visually, go to Region Comparison in the left-hand panel. To add species to this view, click on the Select species or regions button. Select F. verticillioides again then close the menu. This page, similar to the Region in detail view, shows the chromosome positions first. We can see the location of this alignment on chromosome 2 in F. solani. You can scroll down to the most detailed image to view aligned regions, which are highlighted and linked in green.
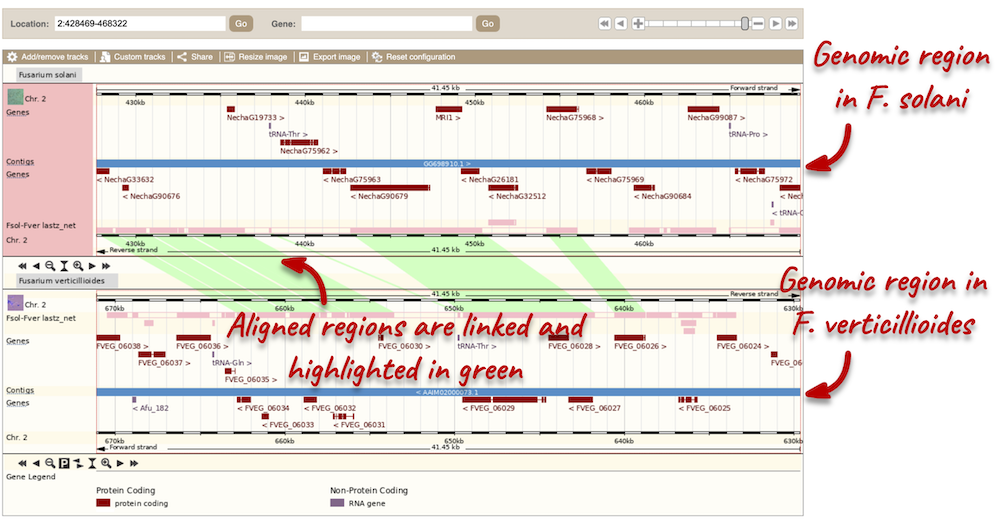
You can add data to both of these views with the same options you had in the Region in detail page. Click on Configure this page to open the menu.
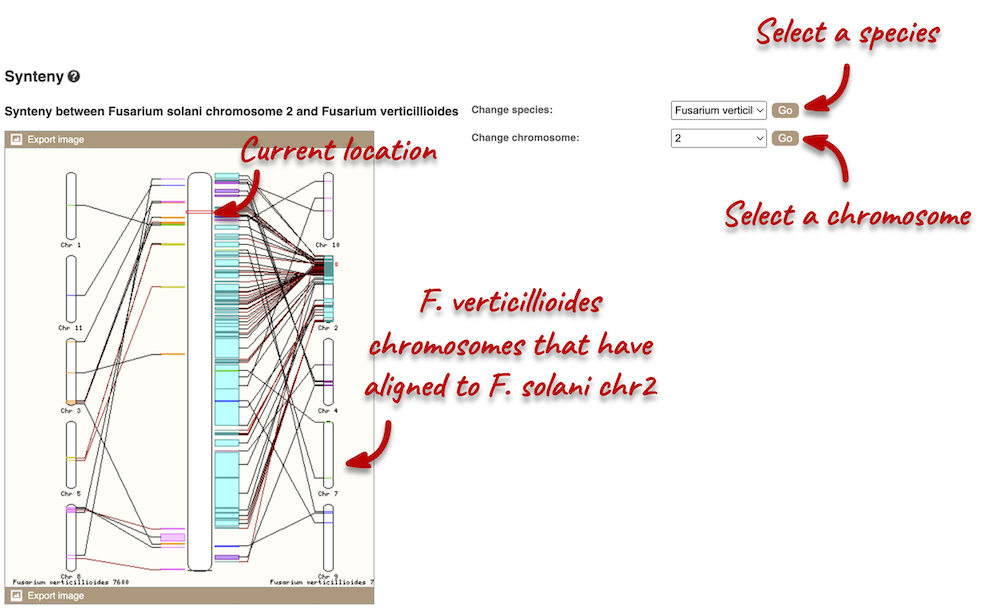
Synteny
We can view large-scale syntenic regions from our chromosome of interest. Click on Synteny in the left-hand panel. Black linking lines indicate sequences are oriented in the same directed, red linking lines indicate the sequences are inverted.