Exploring a Drosophila melanogaster gene, Demo
Demo: The gene tab
We’re going to look at the Mdr65 gene in Drosophila melanogaster. This is a multi drug resistance gene. ‘Mdr65 decreases toxicity of multiple insecticides in Drosophila melanogaster’ by Sun et al. (2017) showed that knocking-down expression of Mdr65 showed increased sensitivity to nine different pesticides. We’re going to explore the data we can find for this gene in Ensembl.
From the metazoa.ensembl.org homepage, type Mdr65 into the search box and choose Drosophila melanogaster from the drop down menu, and click the Go button. Click on the gene name.
The Gene tab will open on the Summary page:
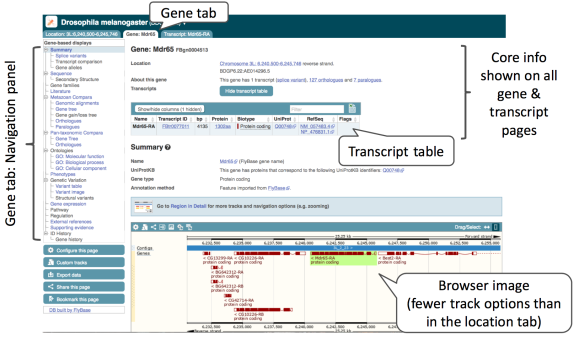
Let’s walk through some of the links in the left hand navigation column.
How can we view the genomic sequence? Click Sequence in the left-hand navigation panel.
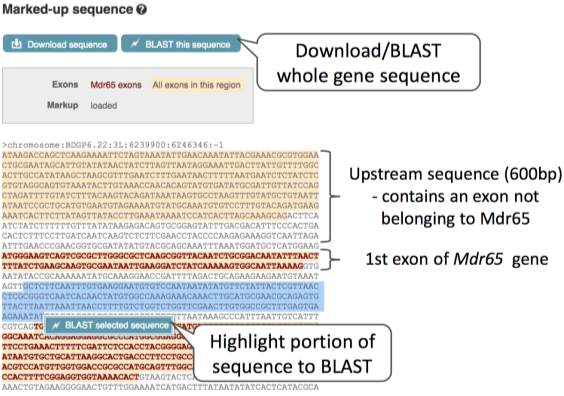
The sequence is shown in FASTA format. Let’s take a look at the FASTA header:

We can make changes to the display and add some annotations to the sequence, such as variants. Click on button below the left-hand navigation panel.
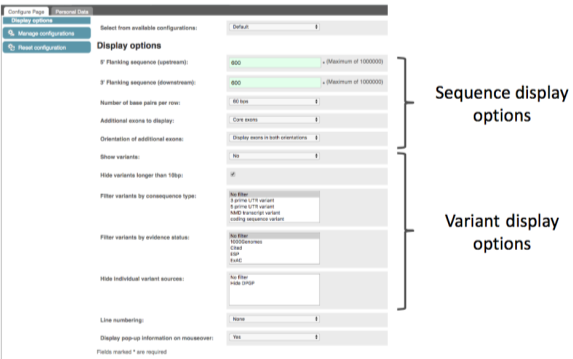
Find the Show Variants drop-down box and choose the option Yes and show links. Find the Line numbering drop-down box and choose Relative to sequence. Close the pop-up by clicking on the tick in the top right or anywhere outside the box.
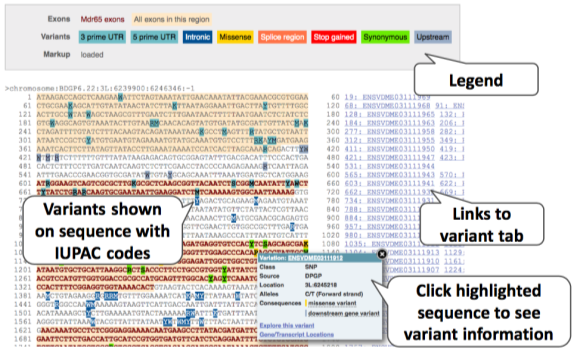
Variants are shown as IUPAC ambiguity codes: https://droog.gs.washington.edu/parc/images/iupac.html.
You can download this sequence by clicking the button above the sequence. This will open a dialogue box that allows you to pick between plain FASTA sequence, or sequence in RTF, which includes all the coloured annotations and can be opened in a word processor. This button is available for all sequence views.

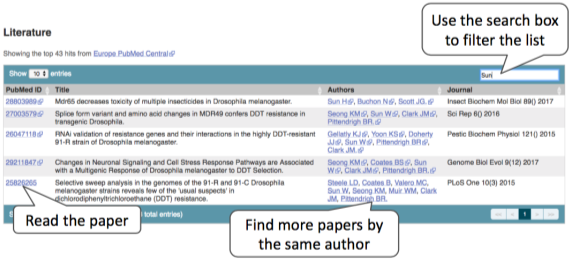
Click now on the Literature link on the left of the page. Here we can see all of the papers that mention this gene, from PubMed Central. We can use the filter search box at the top left to find papers, as shown below.
If you want to find out more about the function of your gene of interest further click on the Gene Ontology links, GO: Cellular component, GO: Molecular function, and GO: Biological process.
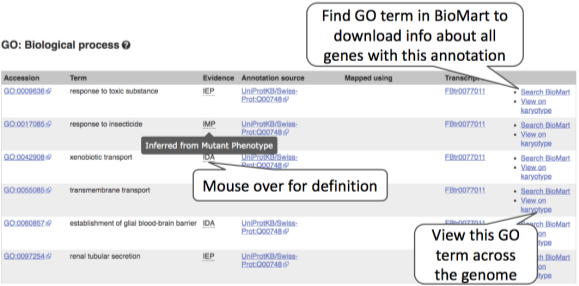
We can see from the GO: Biological process terms that this gene is involved in transmembrane transport, and responses to various chemicals.
Let’s now take a brief look at Comparative Genomics. This is how we can find this gene in other species.
In all Ensembl Genomes sites, there are two sections: a section for within division (e.g. metazoa) comparative genomics, and a section for pan-taxonomic compara which compares a few species from each division.
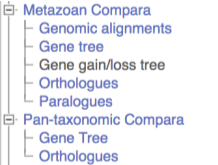
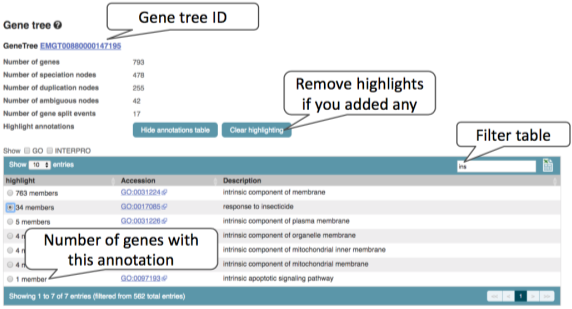
We’ll start by looking at Metazoa Compara. Click on Gene Tree. You can add annotations to the gene tree to highlight genes annotated with GO or InterPro annotations. Note that this will fully expand the tree. Also, remember that non-model organisms will have fewer annotations, so this might not be representative.
If we scroll further down we see the gene tree image, with protein alignments on the left.
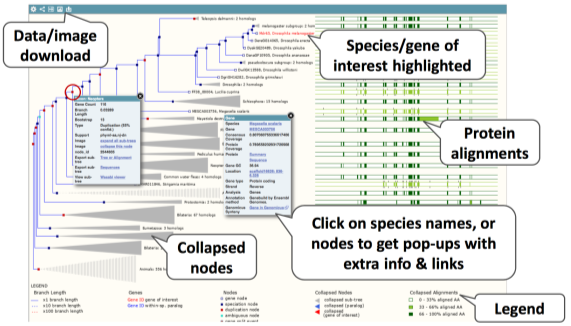
If you click on the Orthologues (or Paralogues) link on the left, we see the data from this image in a table format for each species in Ensembl Metazoa.
Demo: The transcript tab
Let’s now explore one splice isoform (aka transcript). Click on Show transcript table at the top.

Click on the transcript ID FBtr0077011. This takes us to the transcript tab where we can see transcript specific information. Lets click on the Exons link on the left-hand navigation panel.
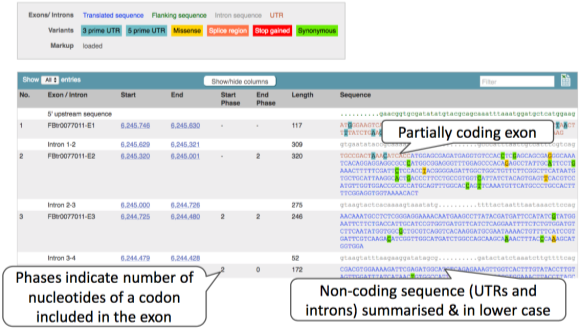
Upstream/downstream sequence is in green lowercase, untranslated is in red CAPITALS, translated sequence is in blue CAPITALS, and, while intronic sequence is in grey lowercase. We can add variants as we did in the gene sequence page. We can also expand the intronic sequence.
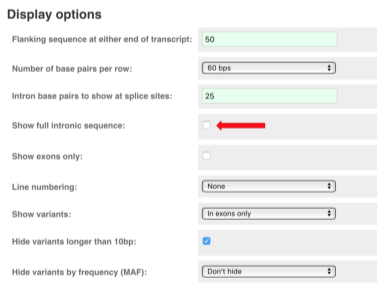
You may want to change the display (for example, to show more flanking sequence, or to show full introns). In order to do so, click on Configure this page and change the display options accordingly.
Now click on the cDNA link to see the spliced transcript sequence.
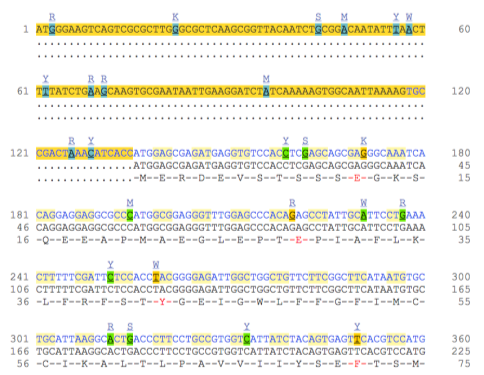
UnTranslated Regions (UTRs) are highlighted in dark yellow, codons in light yellow, and exon sequence is shown in black or blue letters to indicate exon boundaries. Sequence variants are represented by highlighted nucleotides and clickable IUPAC codes are above the sequence. If the amino acid (3rd row) is coloured red then it means there is a variant that causes a change in the protein sequence.
Now click on Protein summary to view domains from Pfam, PROSITE, Superfamily, InterPro, and more.
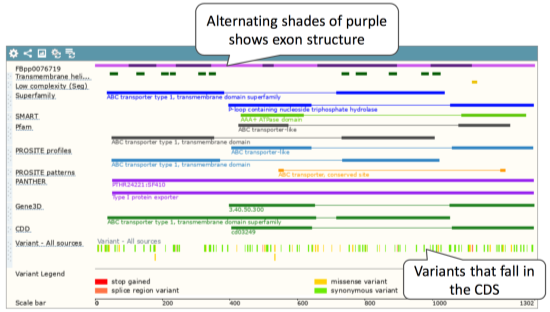
Clicking on Domains & features shows a table of this information.


