Finding comparative genomics data for cultivars in Ensembl Plants, Demo
Demo: Exploring comparative genomics data for cultivars in Ensembl Plants
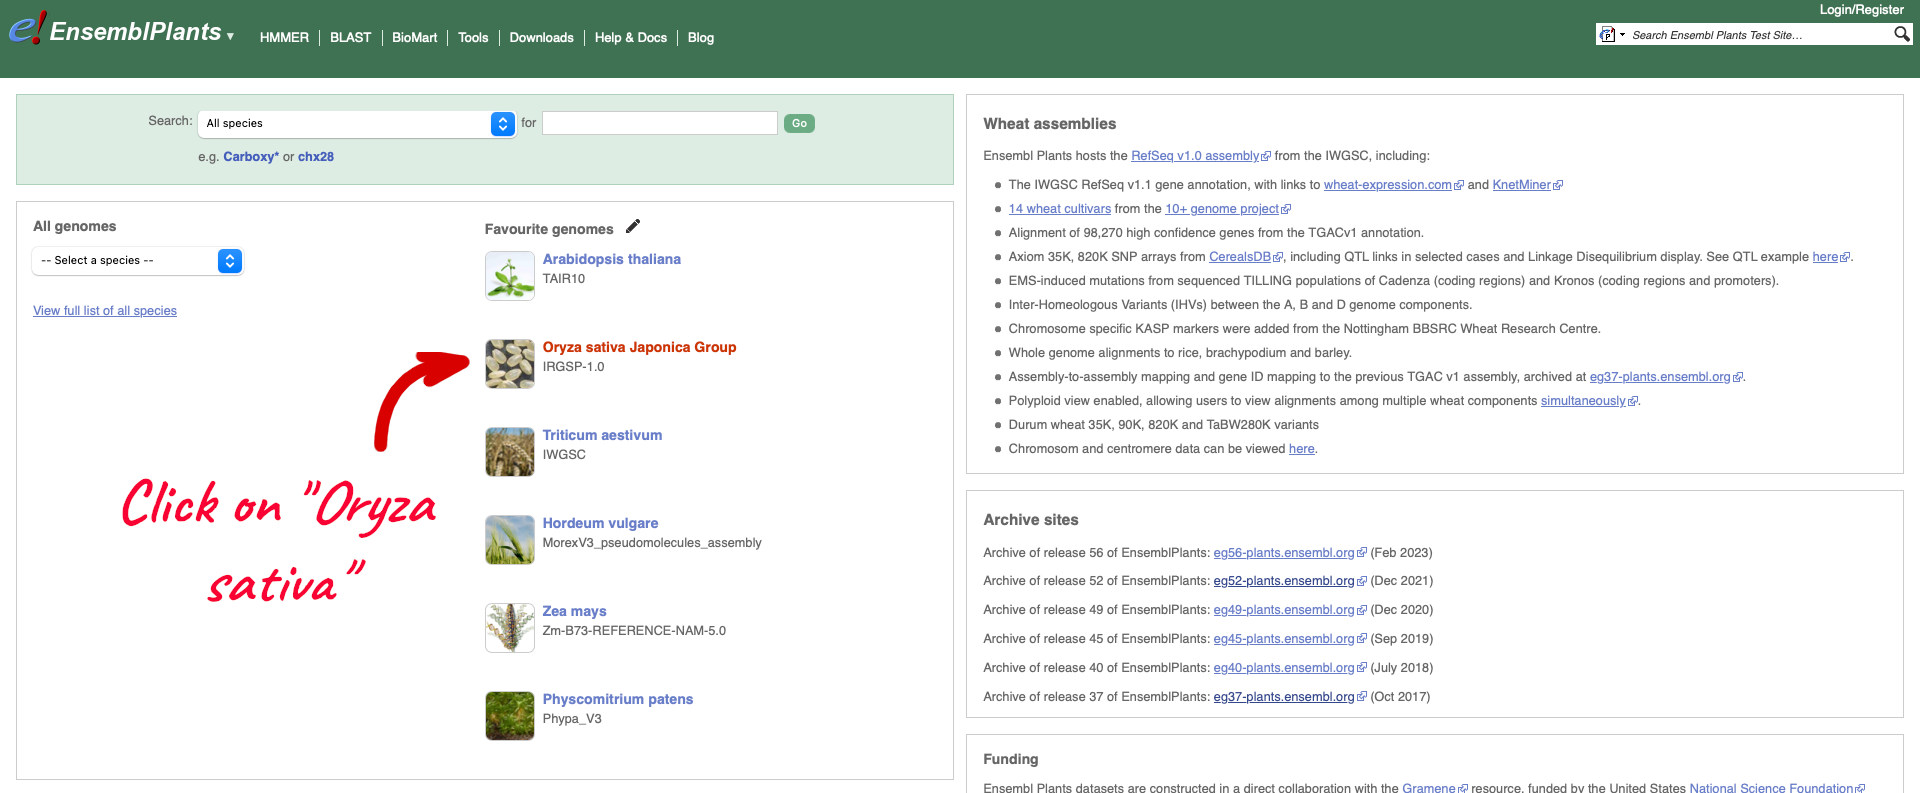
To see the list of cultivars available for your chosen species, select the reference genome for that species. We are going to select Oryza sativa Japonica Group which will take you to the genome’s home page:
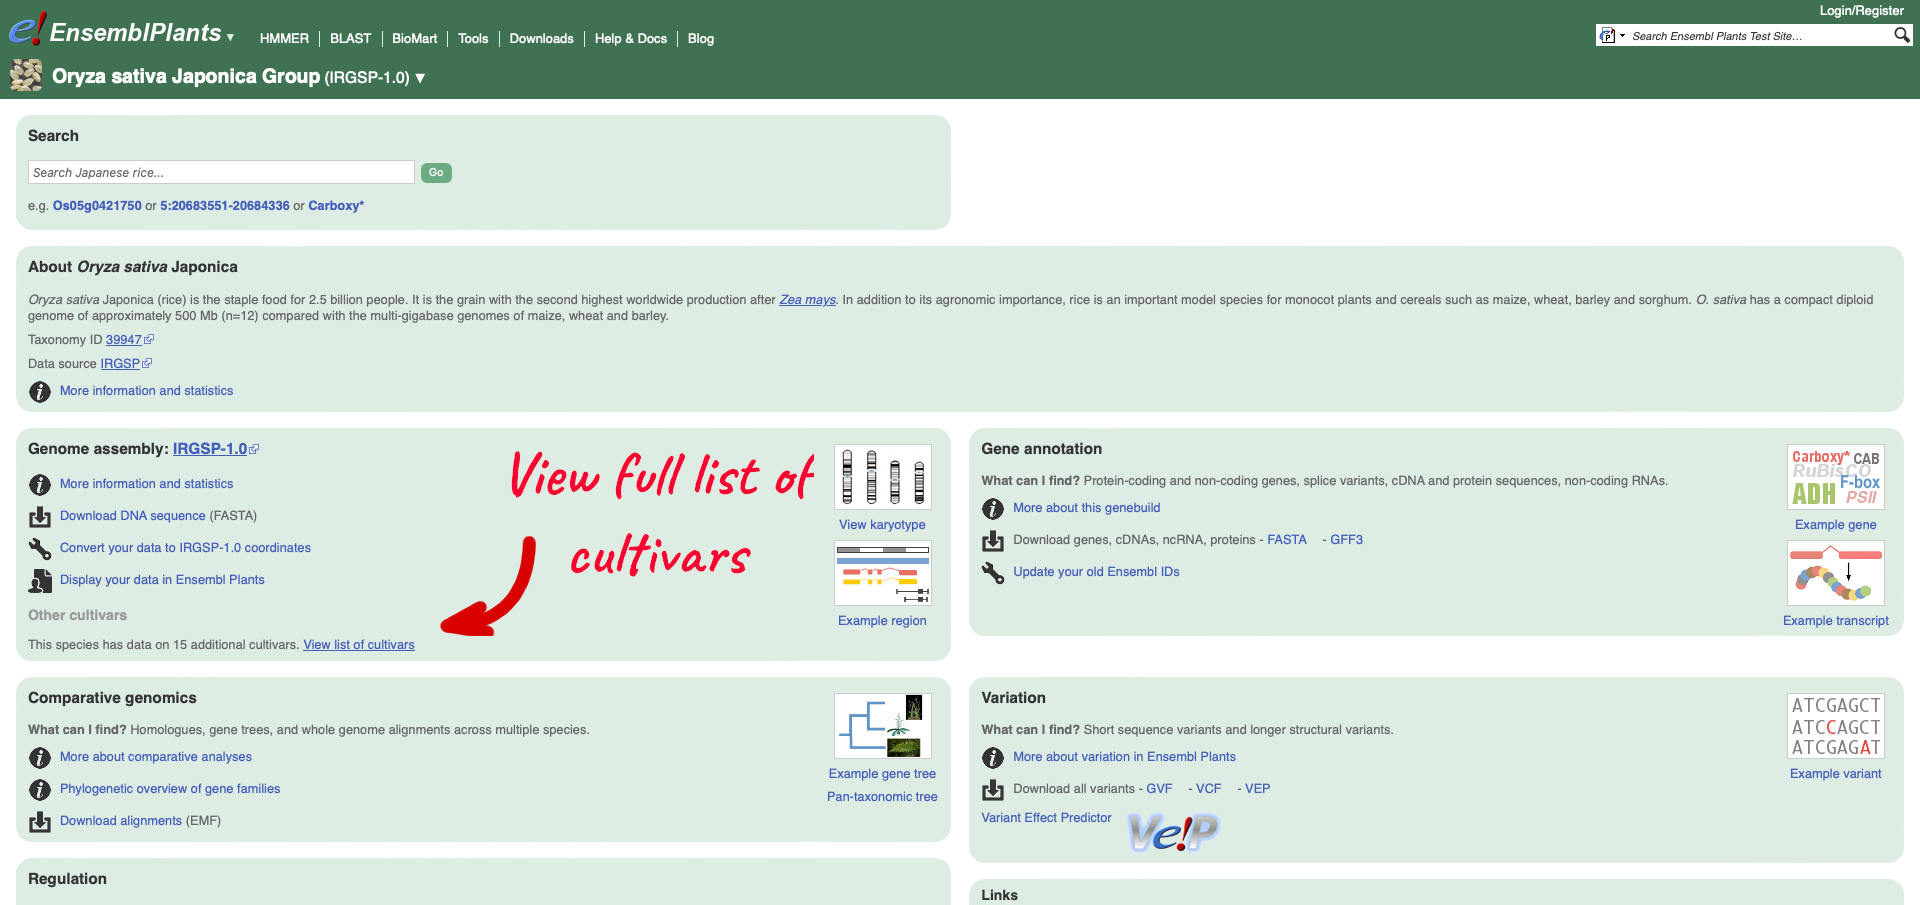
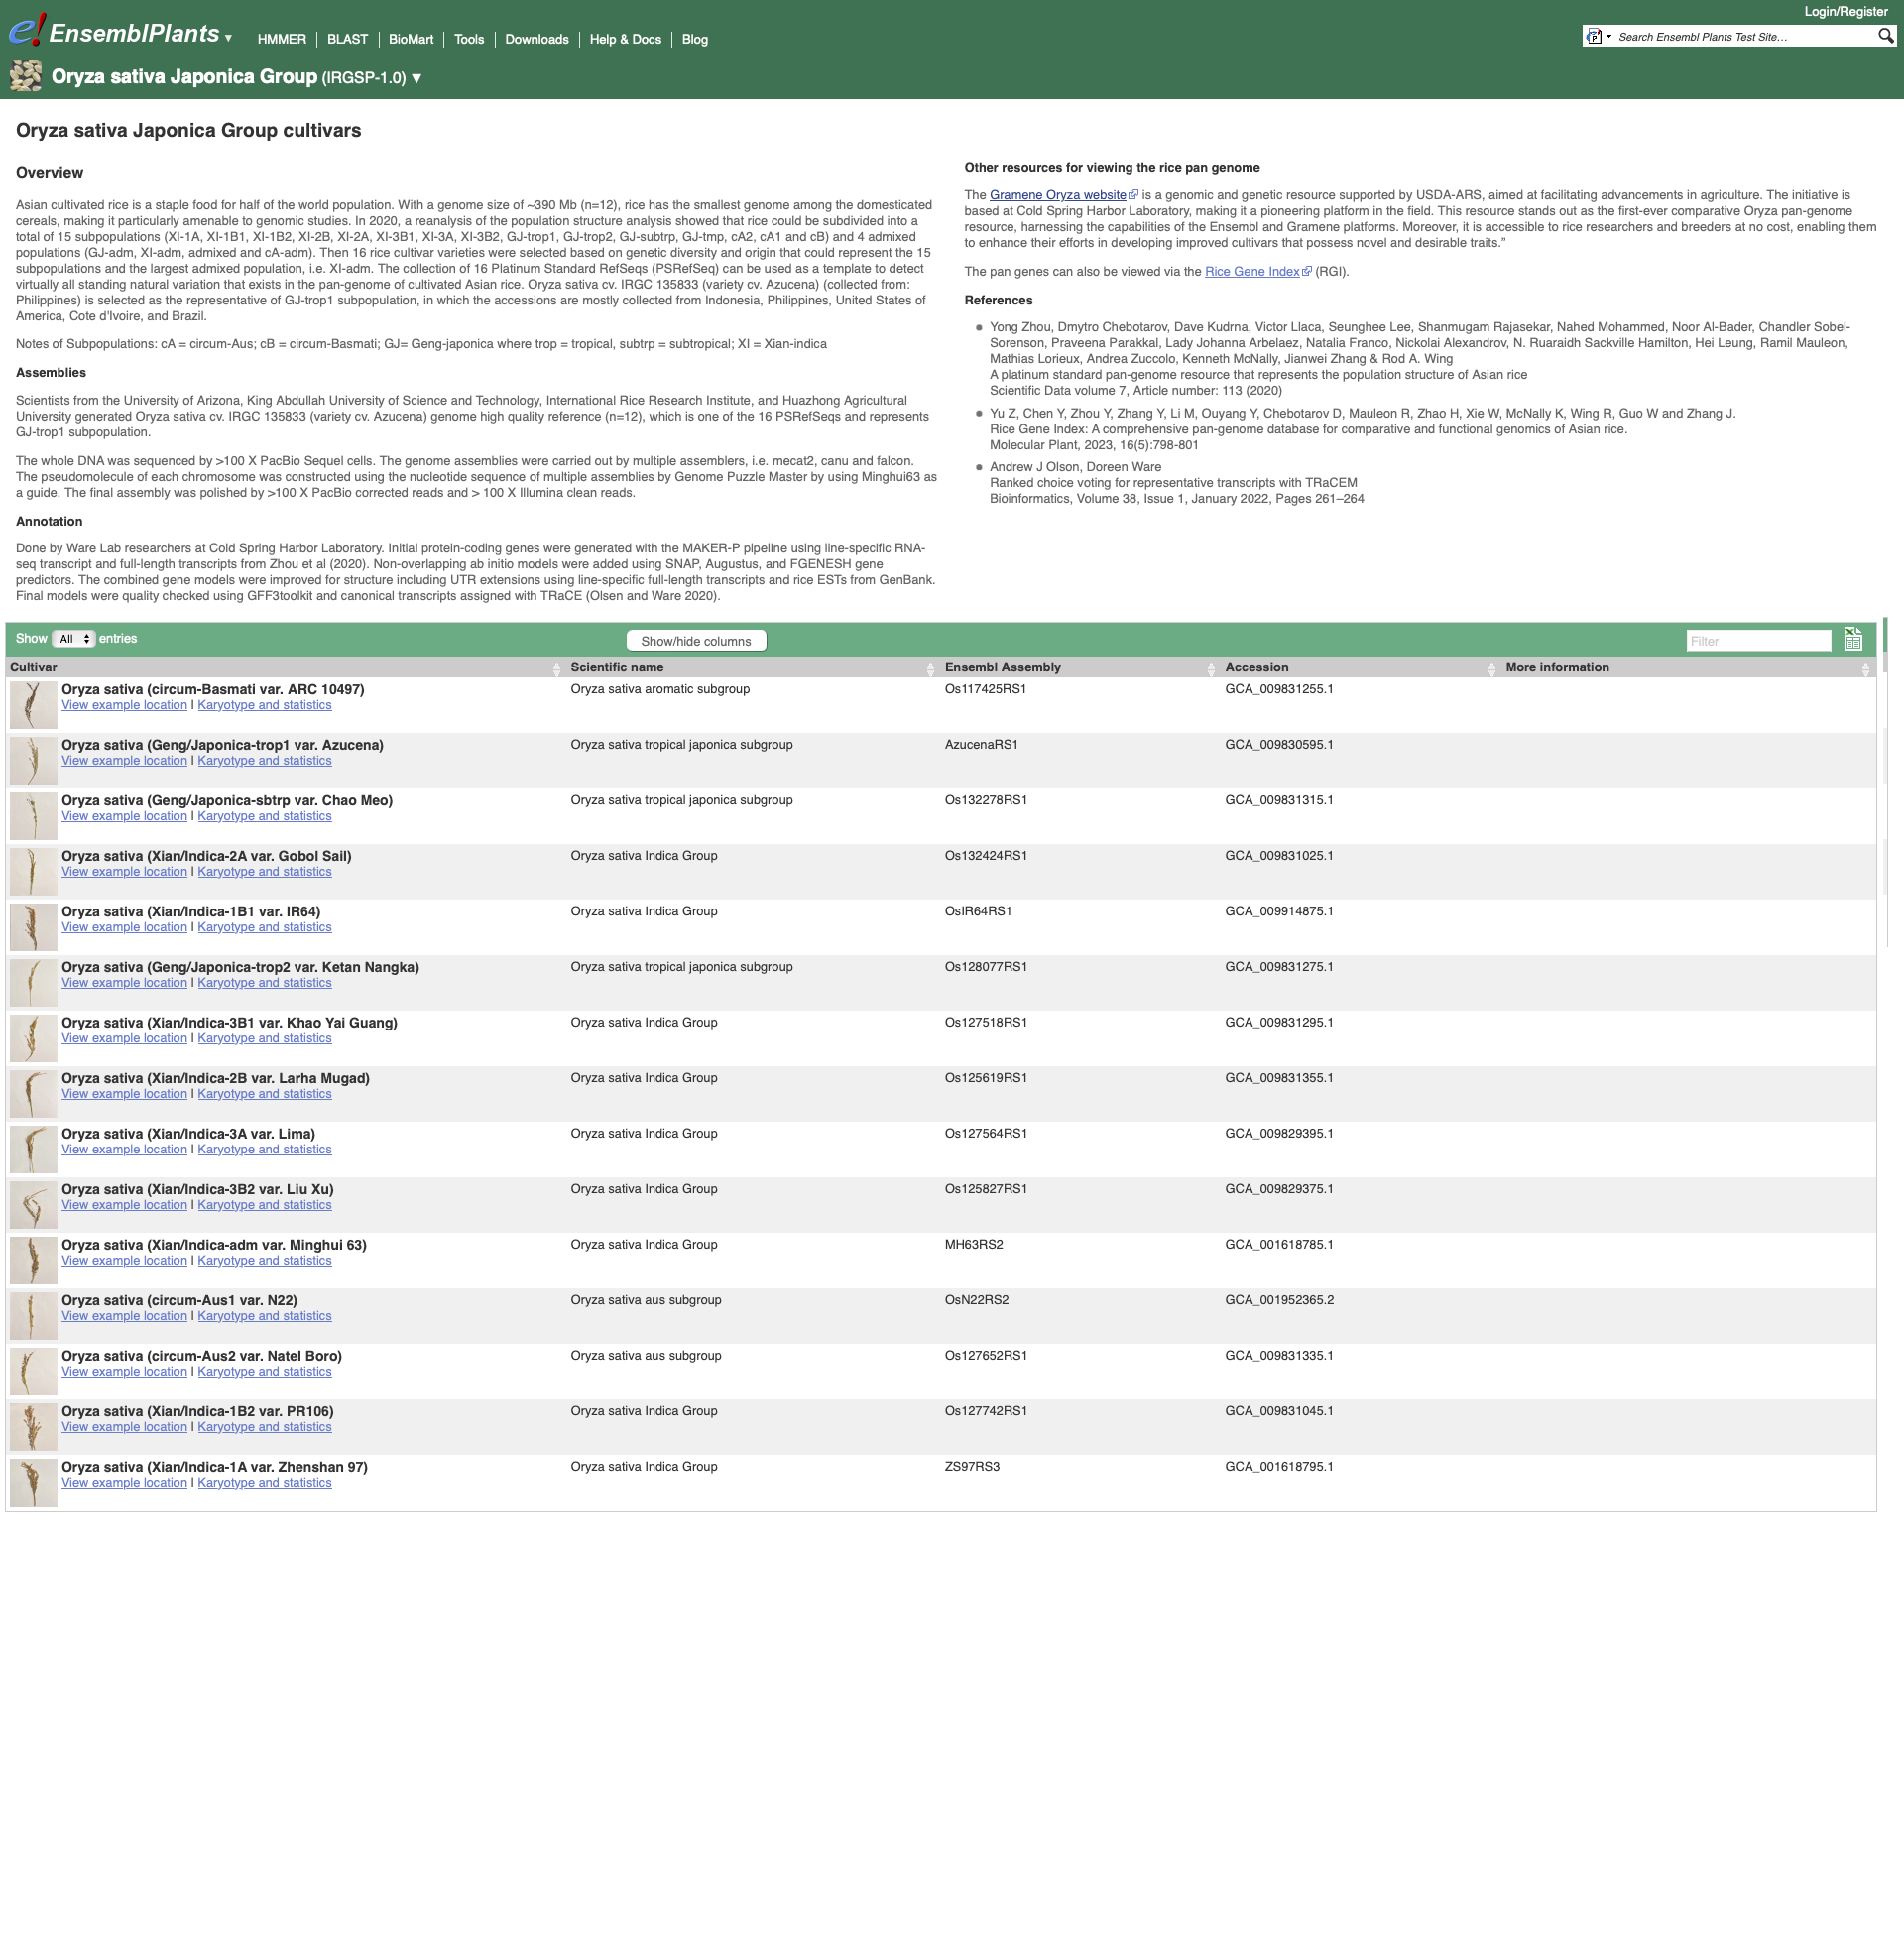
Within the Genome Assembly area there will be a link to ‘View full list of cultivars’ when additional cultivars are available in Ensembl. Clicking this link will take you to a list of all available cultivars, with some overview information and links to access example locations or the genome’s home page for each cultivar.
Returning to the Ensembl Plants homepage, we can search for rice gene Os05g0421300.
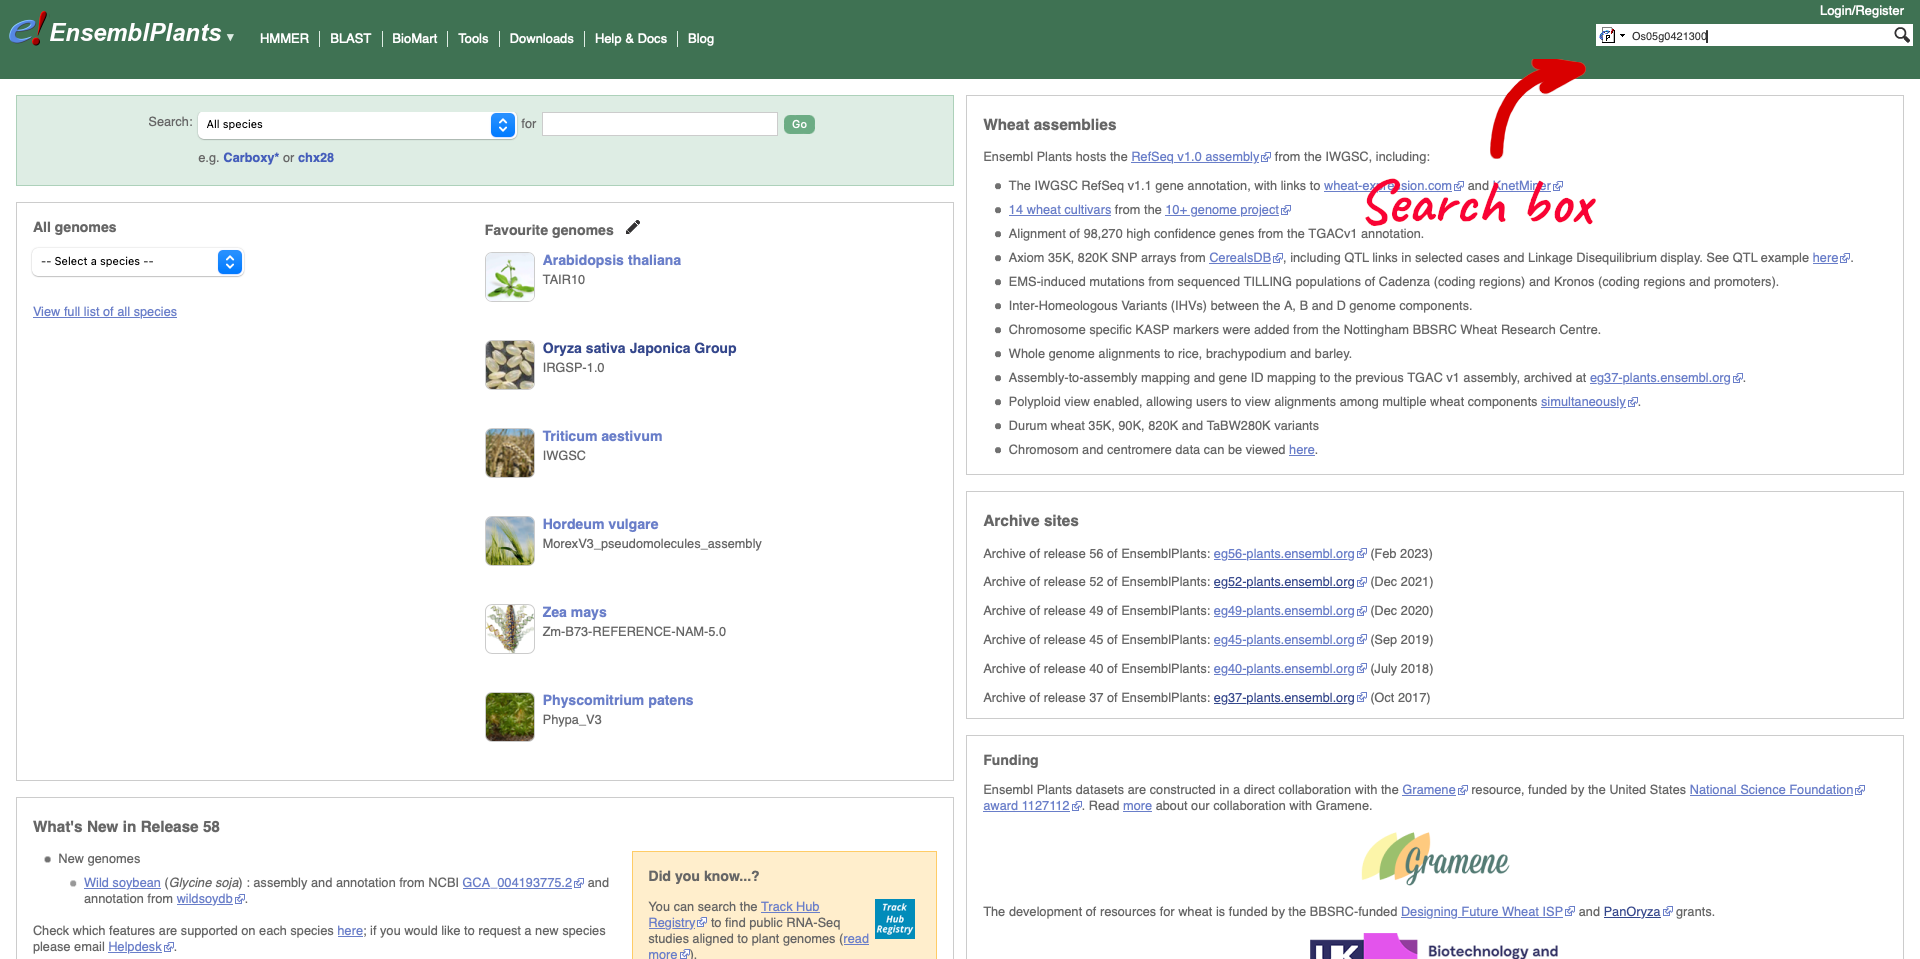
The results return links to the gene page, species home page, location (Chromosome 5: 20,663,027-20,668,604) and gene tree. We are going to select the Gene from species “Oryza sativa Japonica Group”.
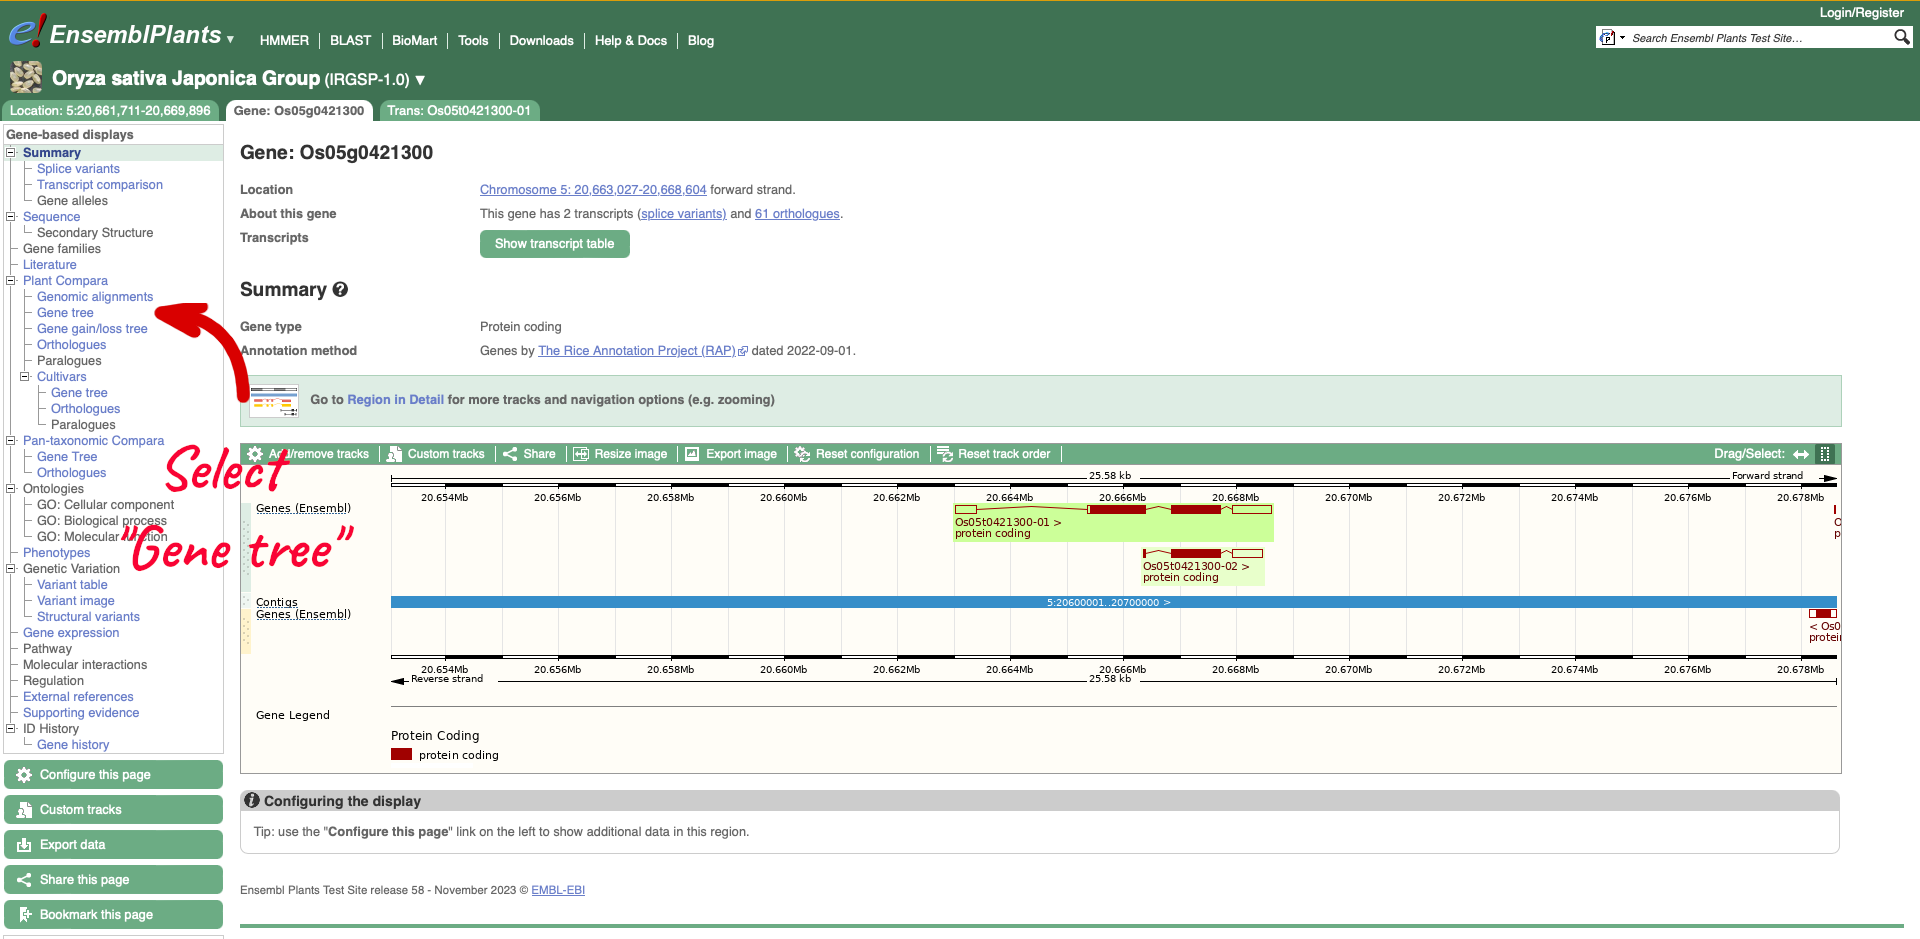
On the left-hand menu there is a sub-menu called ‘Plant Compara’ and a menu within that for ‘Cultivars’. We will select ‘Gene tree’ which will show a gene tree generated by the Gene Orthology/Paralogy prediction method pipeline. Cultivar gene trees are constructed using one representative protein (typically the longest protein-coding translation) for every gene in each cultivar. Cultivars whose genomes have been assembled into chromosomes and have been independently annotated are included into Cultivar comparative analyses.
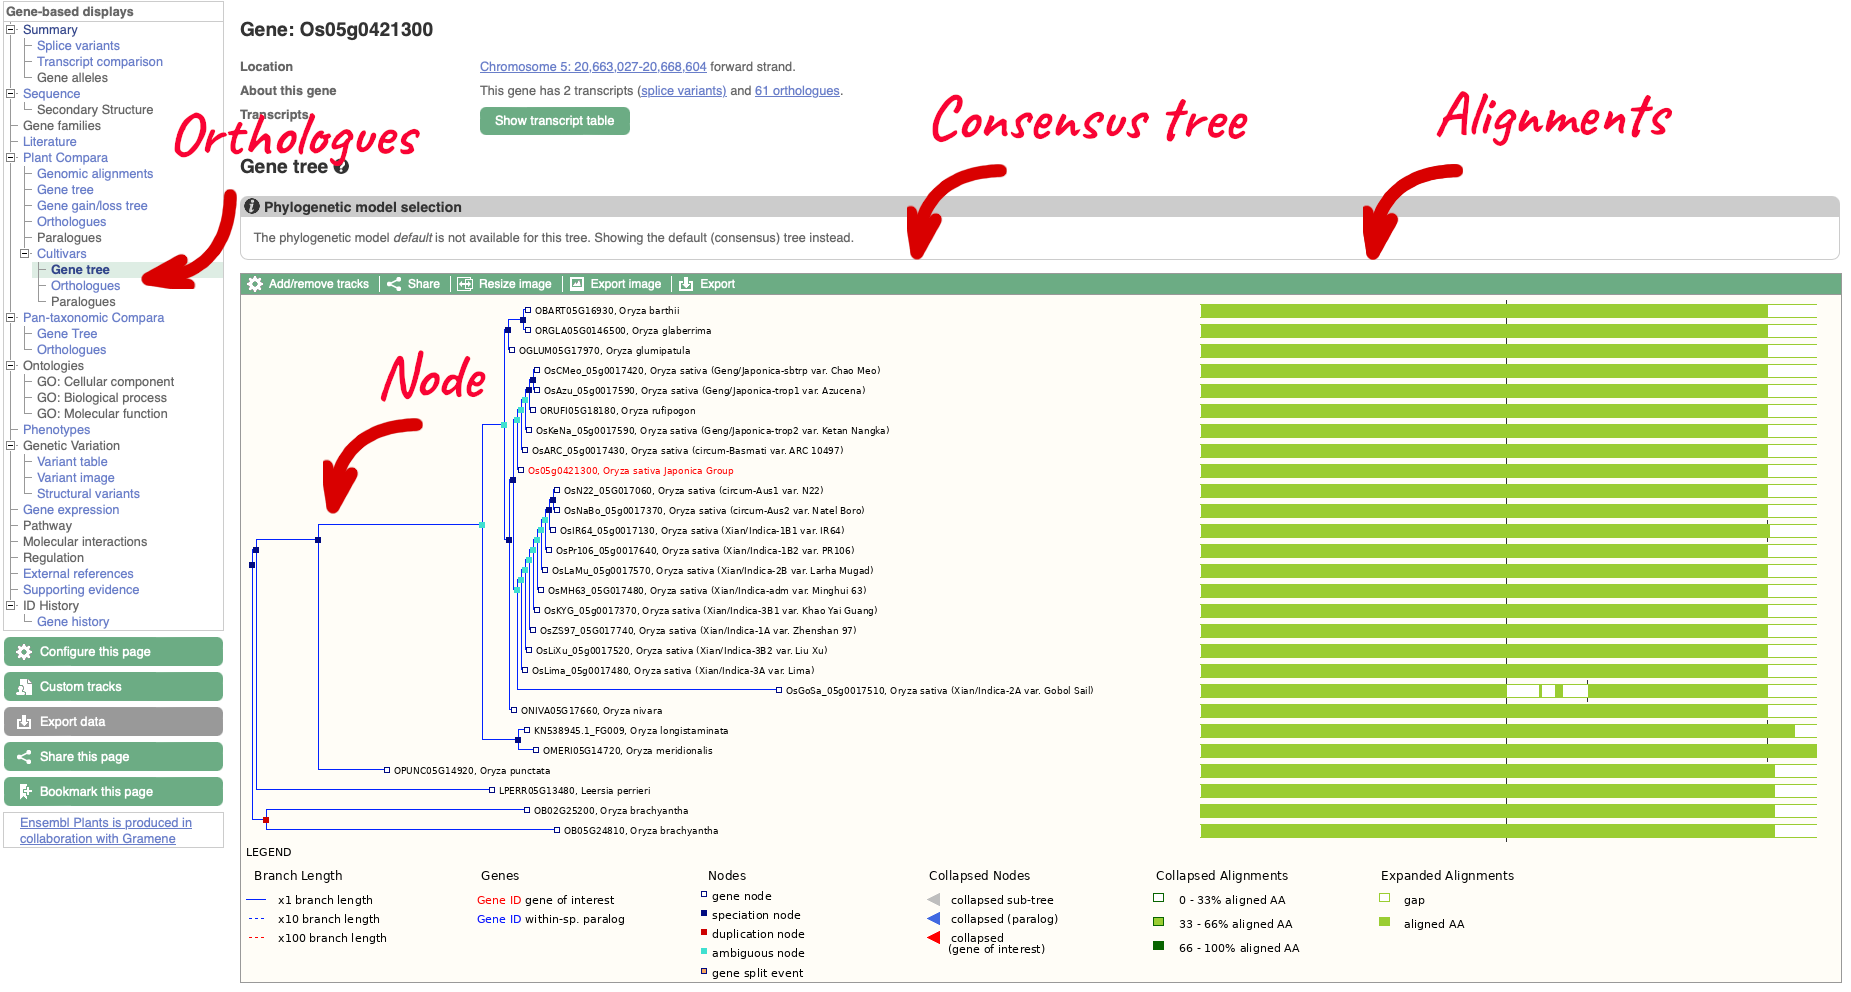
The display shows the consensus tree representing the evolutionary history of this gene and an image of the alignments. Subtrees can be expanded by clicking on a node (blue or red squares) and selecting ‘expand this subtree’ from the pop-up menu. The gene of interest is displayed with red text.
For this example we can see that the two ‘circum-Aus’ cultivars cluster with the ‘Xian/indica’ cultivars, and that the ‘circum-Basmati’ clusters with the ‘Geng/Japonica’ cultivars. Additional Oryza wild relatives are also shown, along with outgroup Leersi perrieri. We can also see from the alignments that the gene is highly conserved, but the representative protein in cultivar ‘Gobol Sail’ has some gaps compared to the others.
On the left-hand menu we can select ‘Orthologues’ from the Cultivar sub-menu of the ‘Plants compara’ menu. This will bring up a table of orthologues which have been inferred from the gene tree. The table lists the species, type of orthologue (e.g. 1-to-1, 1-to-many), links to jump to an orthologue’s gene page, region comparison page (to see an alignment image of the two genes) or text cDNA/protein alignments. Information detailing the percentage identity of the query and target sequences, Gene order conservation (GOC) score, whole genome alignment (WGA) coverage and indication of high confidence (Yes for homology with high percentage identity and high GOC or WGA coverage) are also provided.
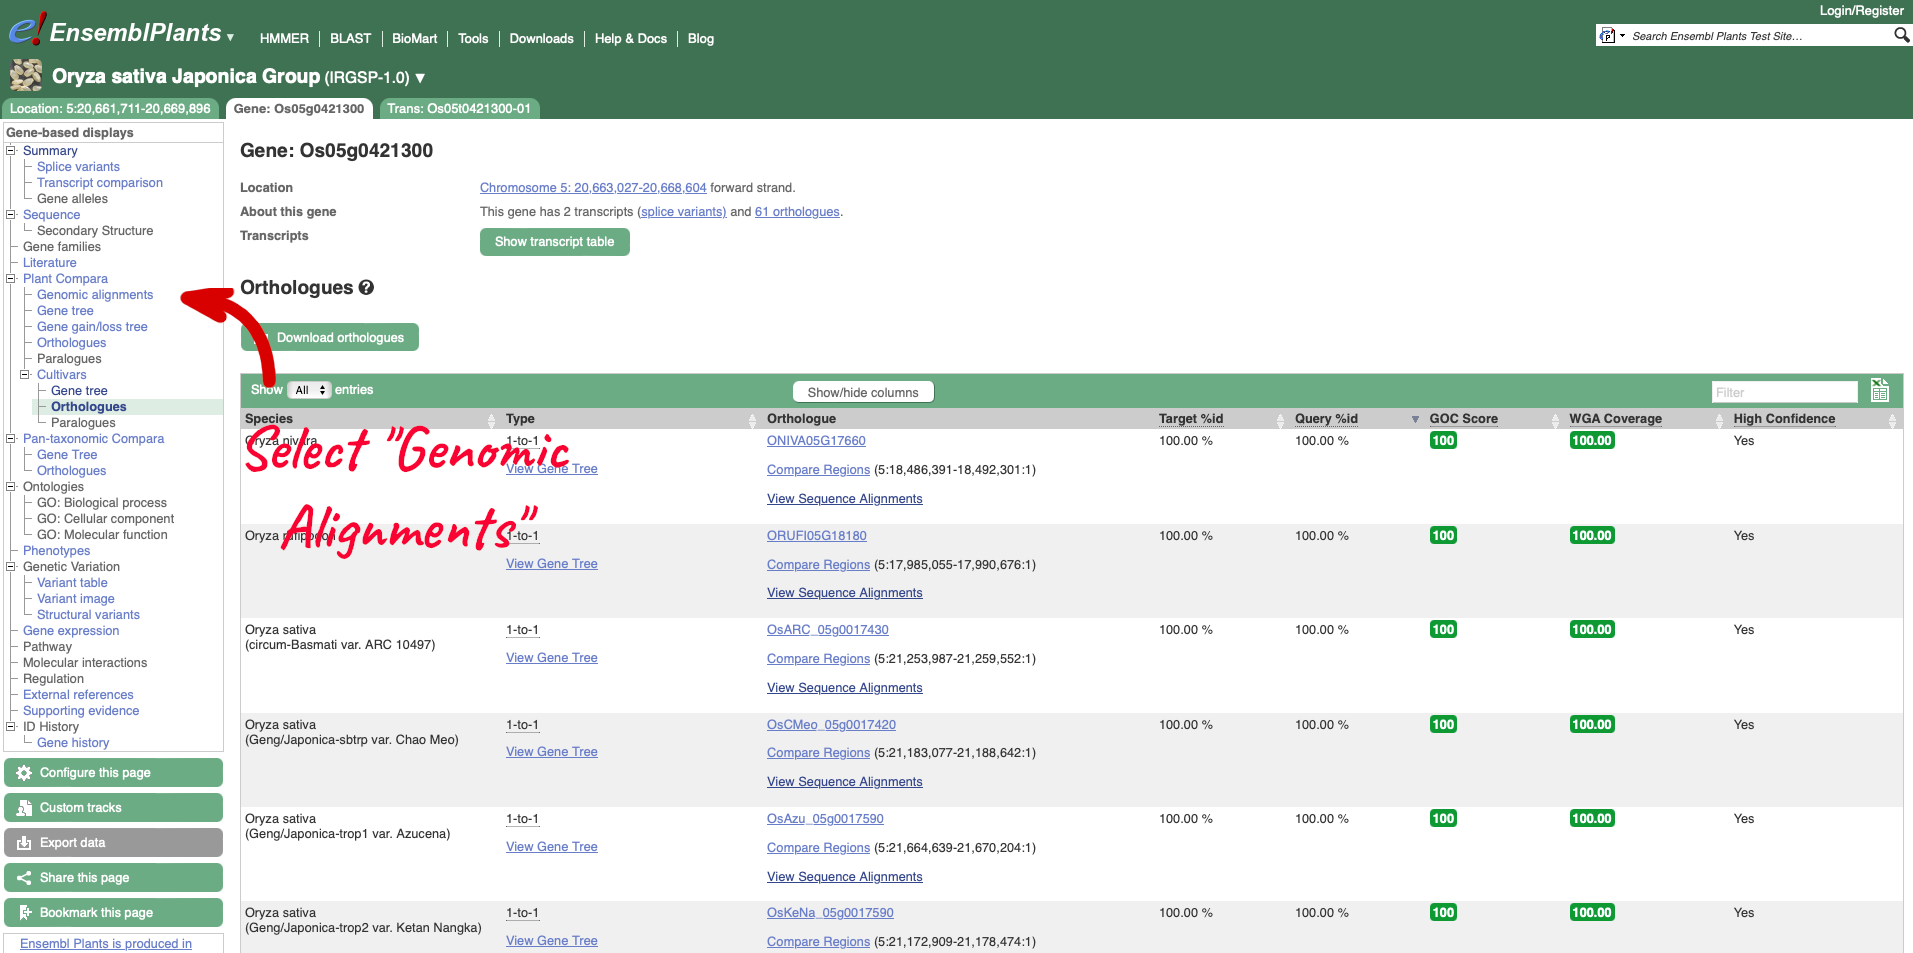
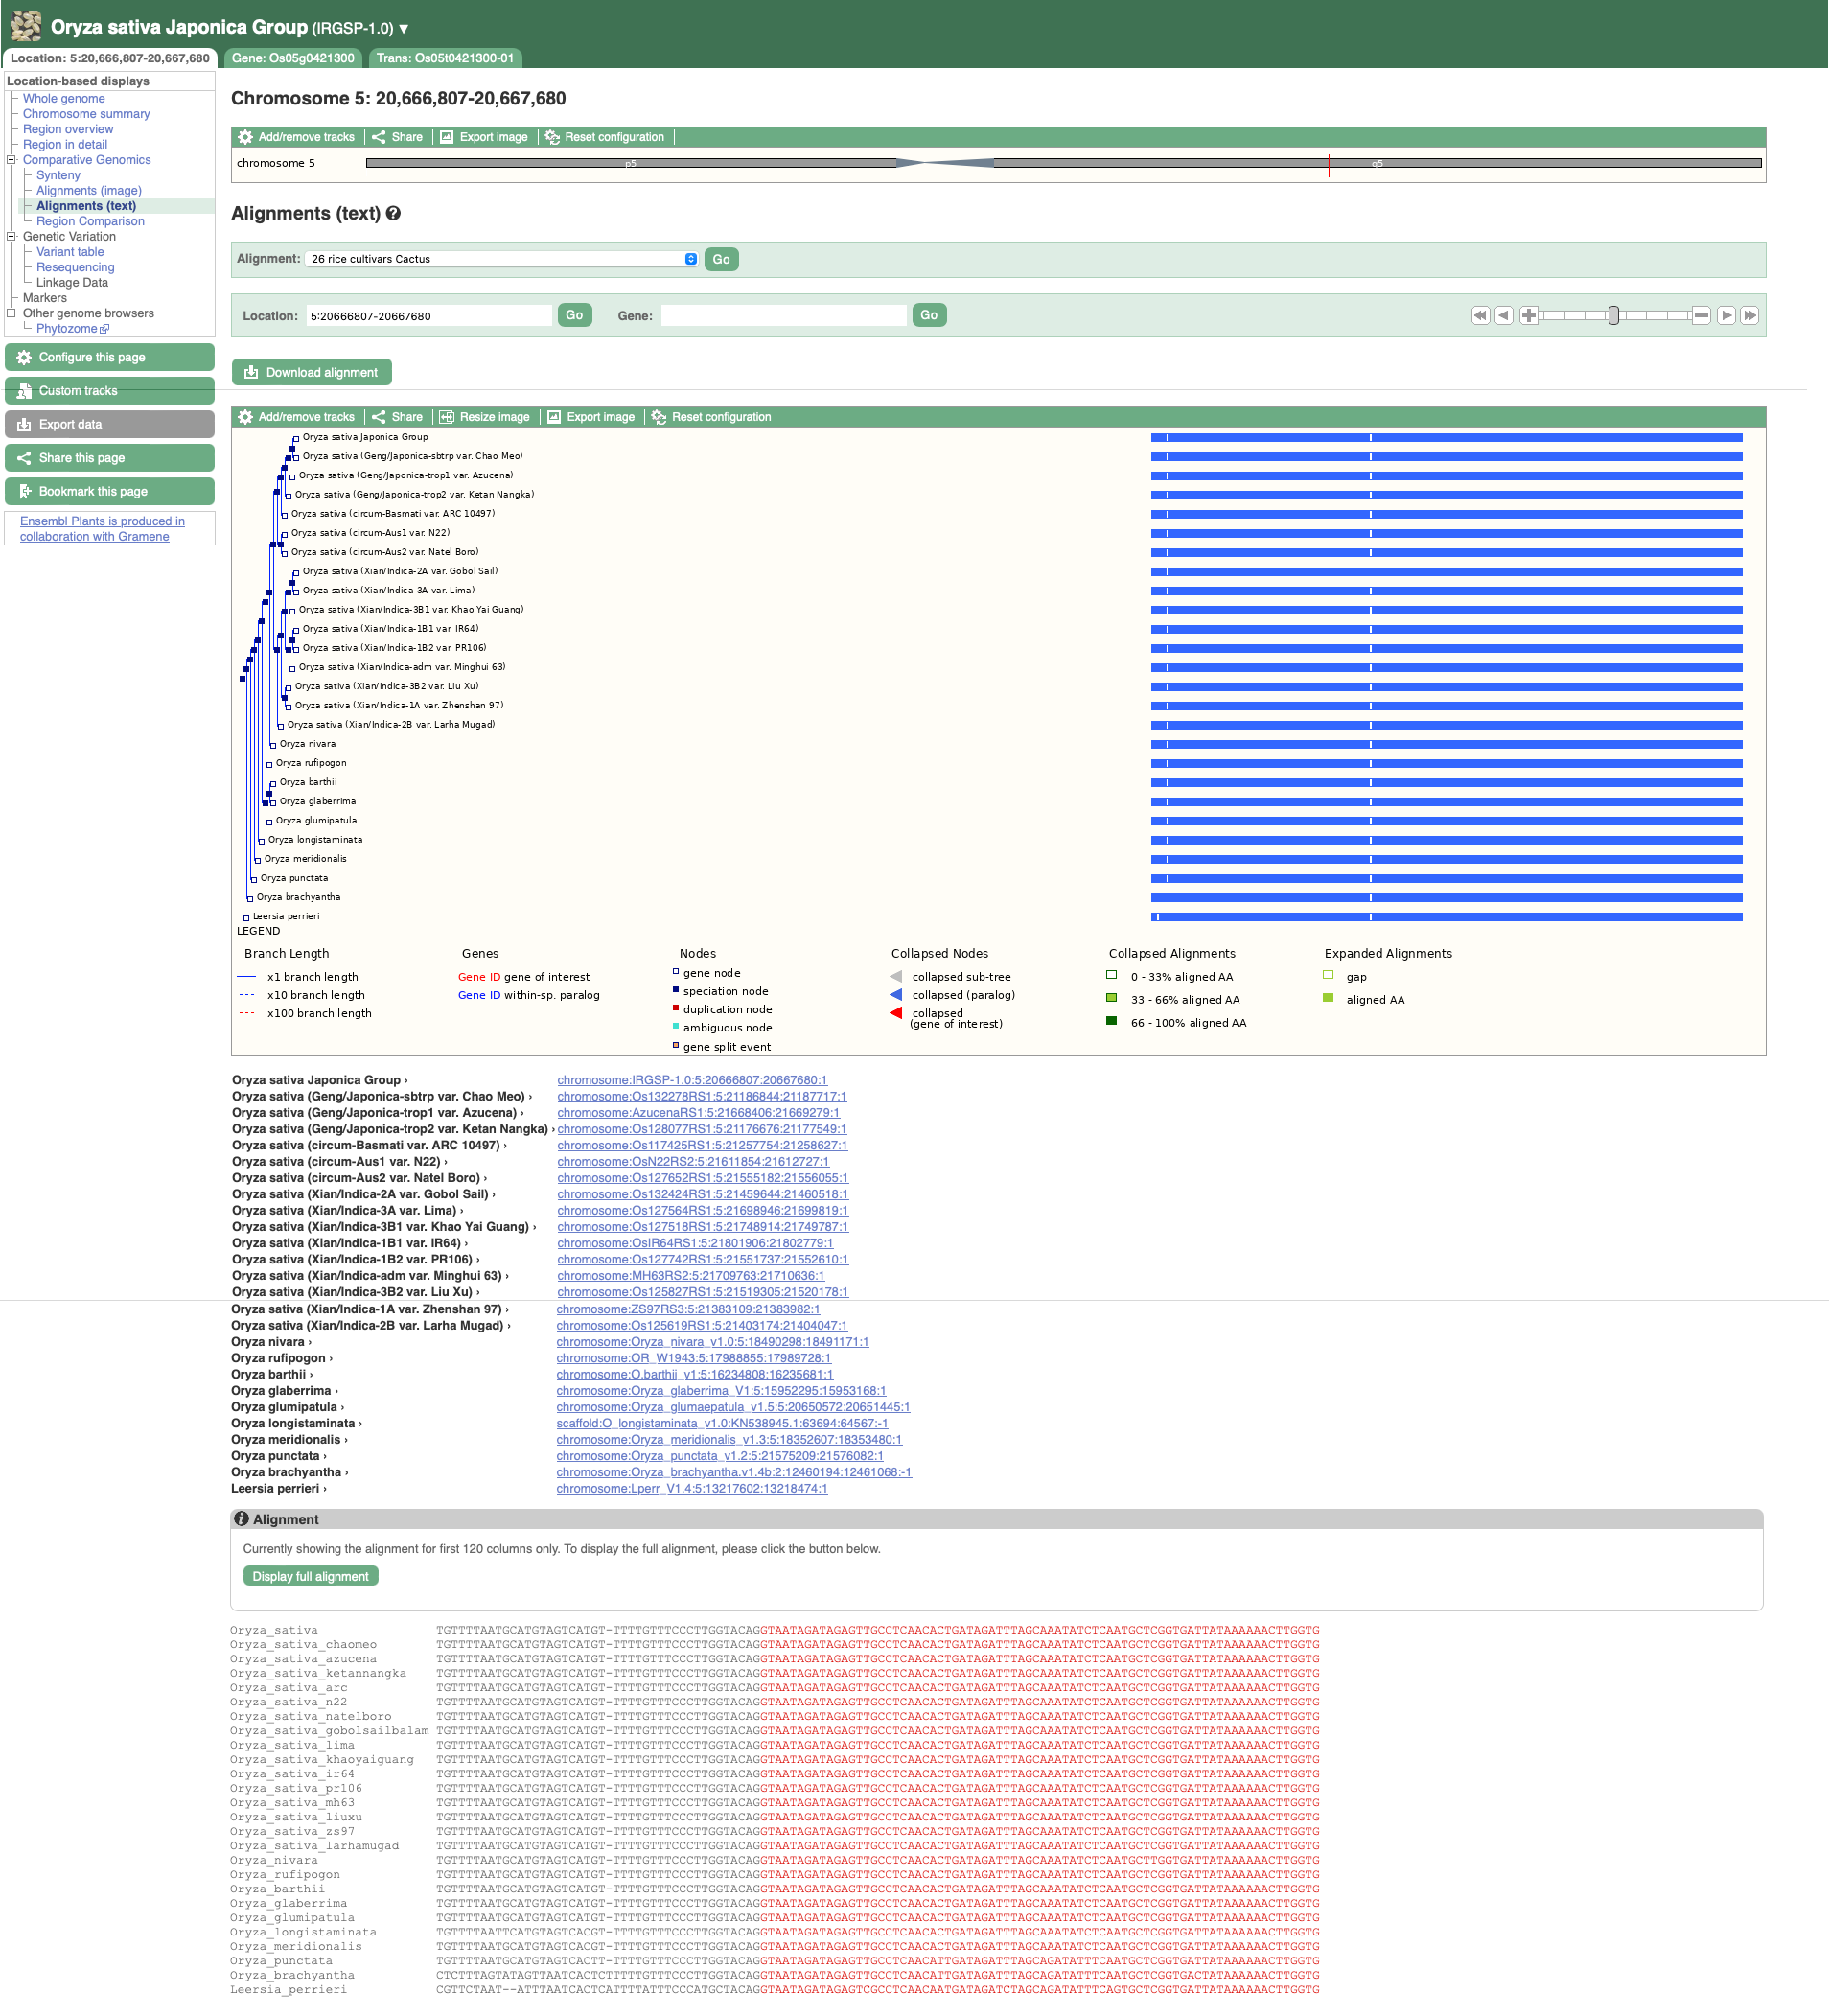
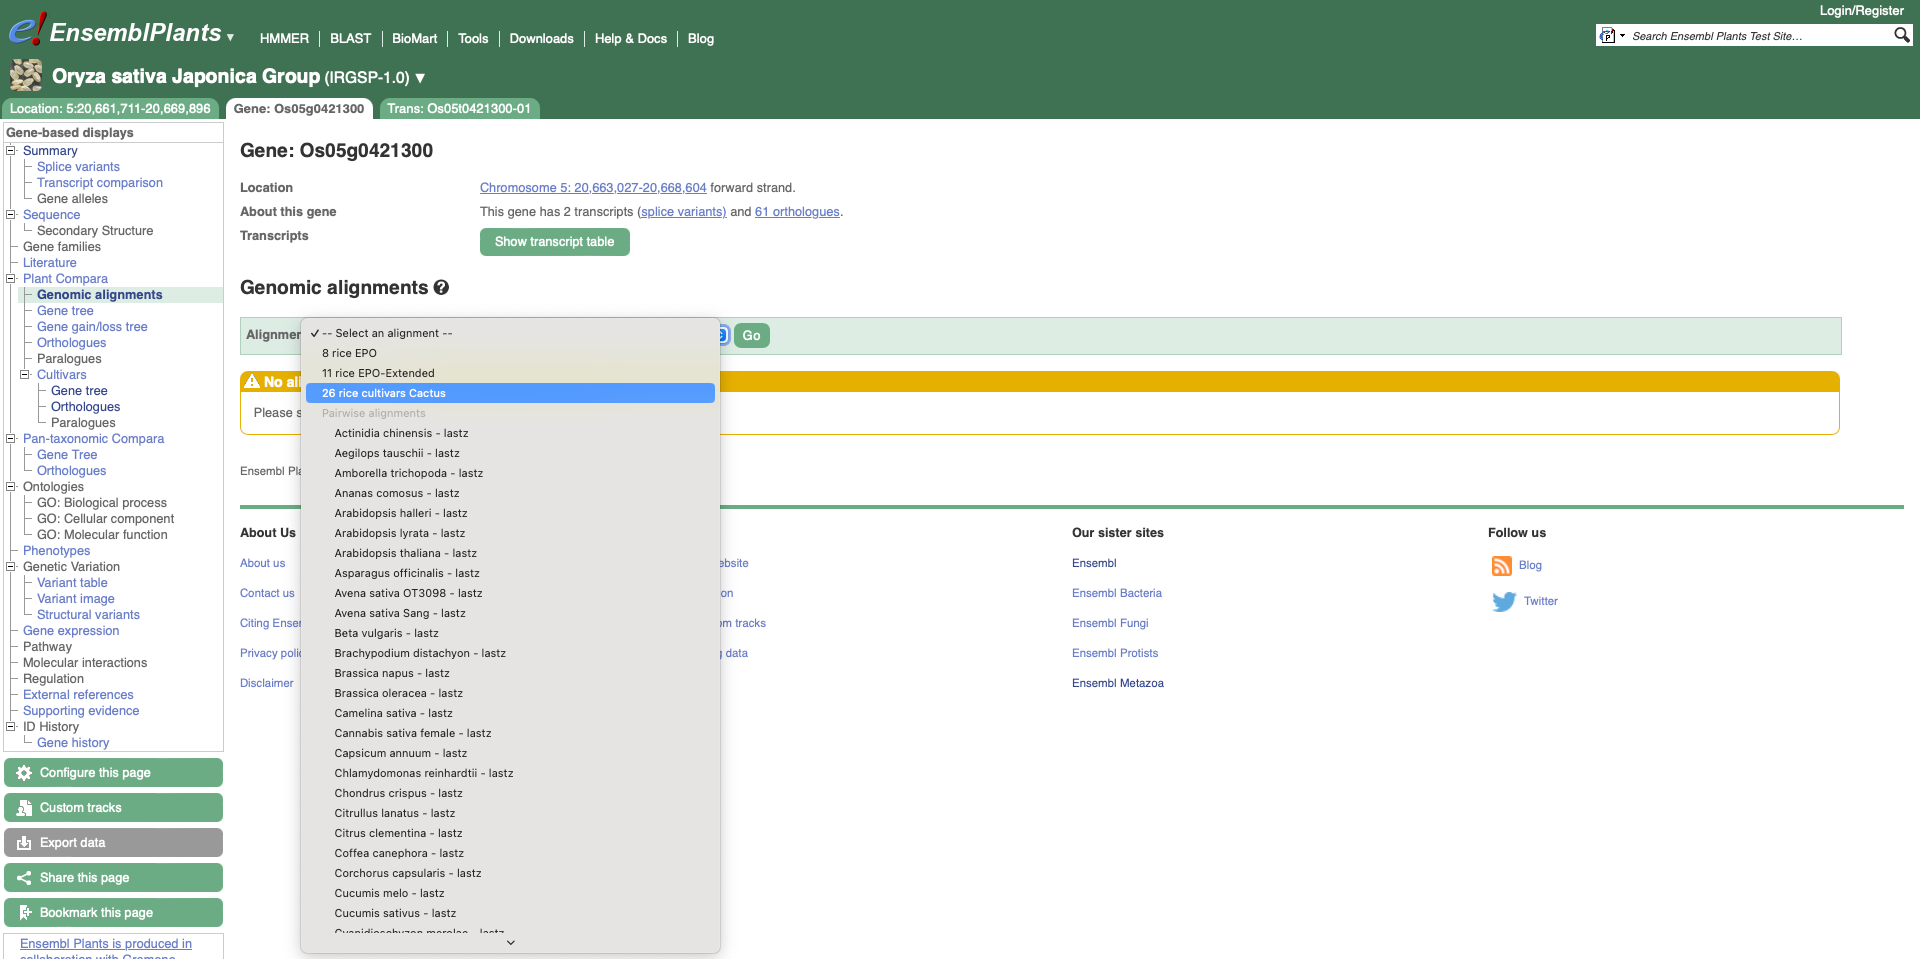
To visualise whole genome alignments in this region, we can use the left-hand menu to select ‘Genomic Alignments’ from the ‘Plants compara’ sub-menu. We can then select which alignment we want to display. Options include multiple genome alignments using the EPO (Enredo, Pecan, Ortheus) pipeline or progressive cactus for cultivar alignments. Pairwise alignments generated with LASTZ or cactus are also available for comparison to other plant species, or other cultivars. We will select the ’26 rice cultivars cactus’ alignment to display.
The resulting alignment is returned in a series of blocks, arranged from longest (block 1) to shortest. The table can also be sorted by location on the reference genome. To view a block’s alignment, click on the name of the block. A tree view depicts the tree from cactus, with the sequence alignment represented on the right. Below the tree view a list of links to each aligned region is provided, and below that the text representation of the alignment with exons shown in red.