Filter Events by Year
Using the Ensembl Variant Effect Predictor – GM4, Molecular Pathology of Cancer, University of Cambridge
Course Details
- Lead Trainer
- Jorge Batista da Rocha
- Event Date
- 2025-02-04
- Location
- School of Clinical Medicine, Addenbrooke's Hospital, Cambridge, UK
- Description
- An introduction to Ensembl genes and variants as part of the University of Cambridge MSt. in Genomic Medicine course. This session focusses on using the Ensembl browser to access germline and somatic variation data and how to use the Variation Effect Predictor (VEP).
Demos and exercises
VEP
We have identified five variants on human chromosome nine, C-> A at 128203516, an A deletion at 128328461, C->A at 128322349, C->G at 128323079 and G->A at 128322917.
We will use the Ensembl VEP to determine:
- Have my variants already been annotated in Ensembl?
- What genes are affected by my variants?
- Do any of my variants affect gene regulation?
Go to the front page of Ensembl and click on the Variant Effect Predictor.

This page contains information about the VEP, including links to download the script version of the tool. Click on Launch VEP to open the input form:
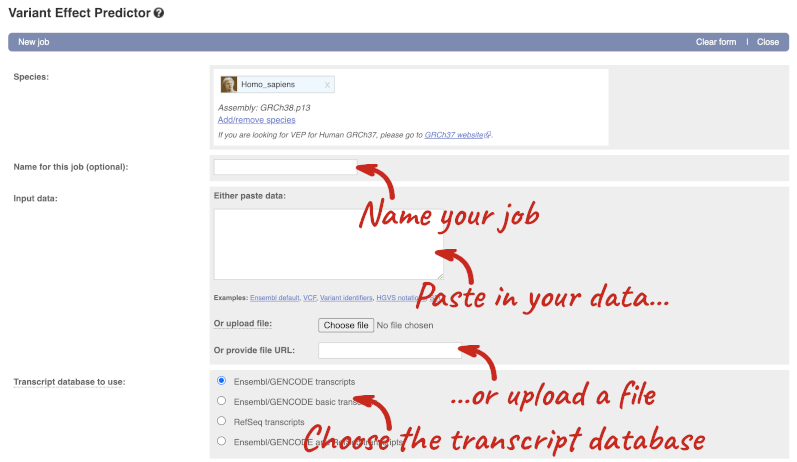
The data is in VCF format:
chromosome coordinate id reference alternative
Put the following into the Paste data box:
9 128328460 var1 TA T
9 128322349 var2 C A
9 128323079 var3 C G
9 128322917 var4 G A
9 128203516 var5 C A
The VEP will automatically detect that the data is in VCF.
There are further options that you can choose for your output. These are categorised as Identifiers, Variants and frequency data, Additional annotations, Predictions, Filtering options and Advanced options. Let’s open all the menus and take a look.
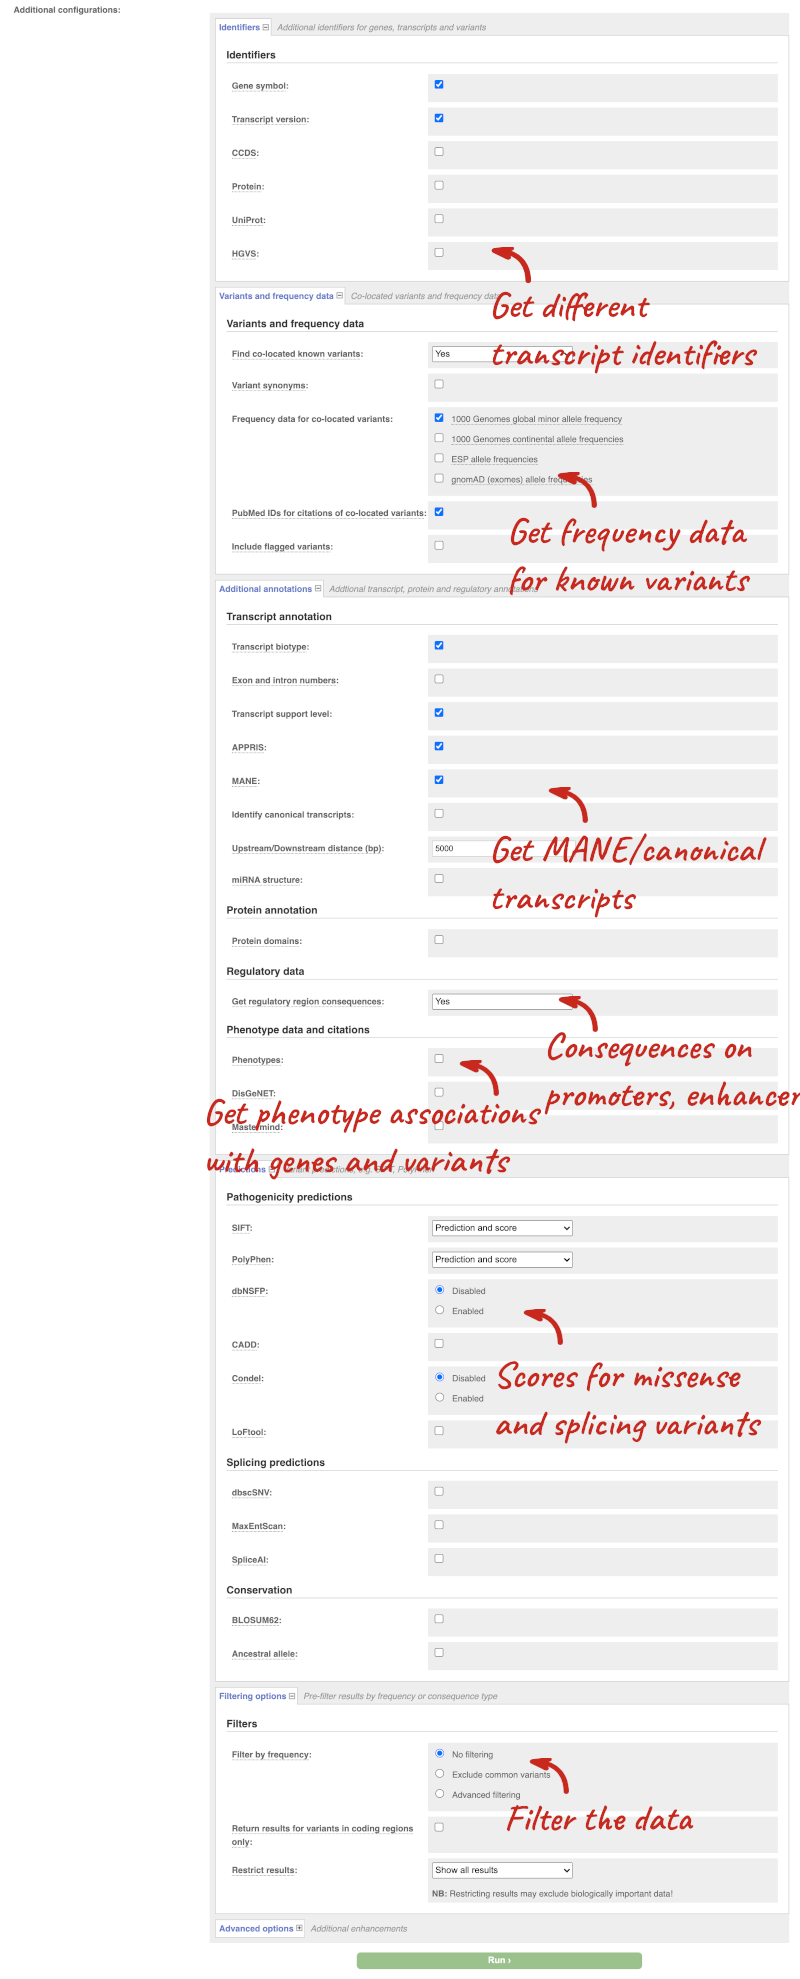
Hover over the options to see definitions.
We’re going to select some options:
- HGVS, annotation of variants in terms of the transcripts and proteins they affect, commonly-used by the clinical community
- Phenotypes
- Protein domains
When you’ve selected everything you need, scroll right to the bottom and click Run.

The display will show you the status of your job. It will say Queued, then automatically switch to Done when the job is done, you do not need to refresh the page. You can edit or discard your job at this time. If you have submitted multiple jobs, they will all appear here.
Click View results once your job is done.
In your results you will see a graphical summary of your data, as well as a table of your results.
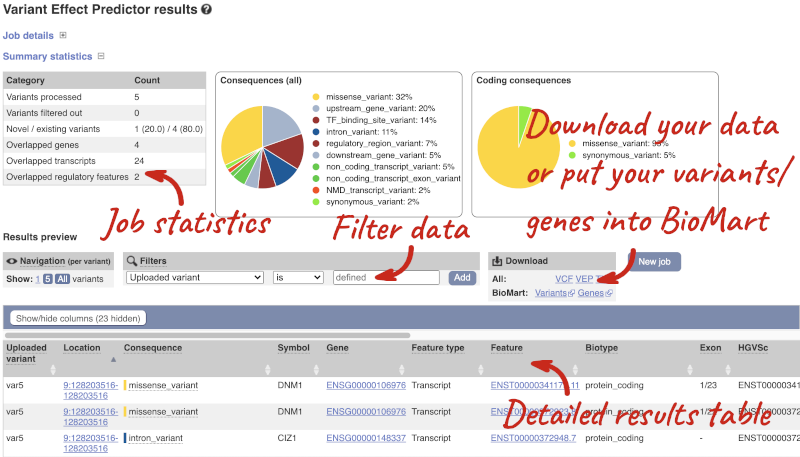
The results table is enormous and detailed, so we’re going to go through the it by section. The first column is Uploaded variant. If your input data contains IDs, like ours does, the ID is listed here. If your input data is only loci, this column will contain the locus and alleles of the variant. You’ll notice that the variants are not neccessarily in the order they were in in your input. You’ll also see that there are multiple lines in the table for each variant, with each line representing one transcript or other feature the variant affects.
You can mouse over any column name to get a definition of what is shown.
The next few columns give the information about the feature the variant affects, including the consequence. Where the feature is a transcript, you will see the gene symbol and stable ID and the transcript stable ID and biotype. Where the feature is a regulatory feature, you will get the stable ID and type. For a transcription factor binding motif (labelled as a MotifFeature) you will see just the ID. Most of the IDs are links to take you to the gene, transcript or regulatory feature homepage.
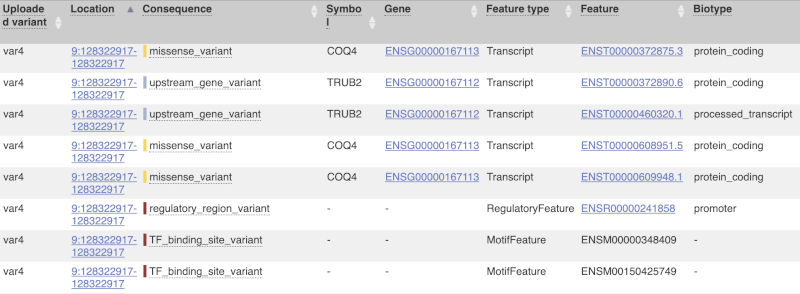
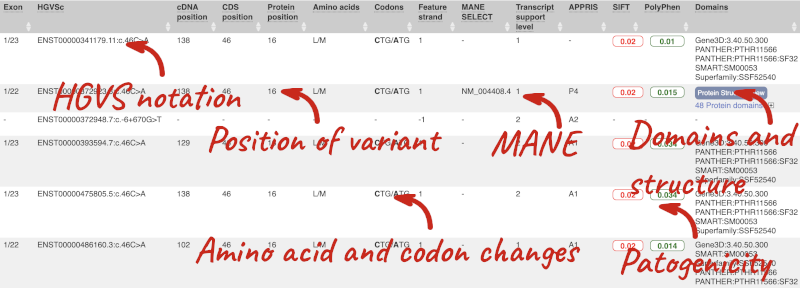
This is followed by details on the effects on transcripts, including the position of the variant in terms of the exon number, cDNA, CDS and protein, the amino acid and codon change, transcript flags, such as MANE, on the transcript, which can be used to choose a single transcript for variant reporting, and predicted pathogenicity scores. The predicted pathogenicity scores are shown as numbers with coloured highlights to indicate the prediction, and you can mouse-over the scores to get the prediction in words. Two options that we selected in the input form are the HGVS notation, which is shown to the left of the image below and can be used for reporting, and the Domains to the right. The Domains list the proteins domains found, and where there is available, provide a link to the 3D protein model which will launch a LiteMol viewer, highlighting the variant position.
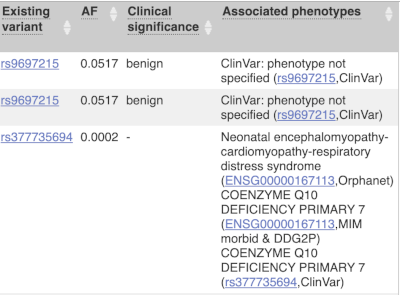
Where the variant is known, the ID of the existing variant is listed, with a link out to the variant homepage. In this example, only rsIDs from dbSNP are shown, but sometimes you will see IDs from other sources such as COSMIC. The VEP also looks up the variant from frequency files, and pulls back the allele frequency (AF in the table), which will give you the 1000 Genomes Global Allele Frequency. In our query, we have not selected allele frequencies from the continental 1000 Genomes populations or from gnomAD, but these could also be shown here. We can also see ClinVar clinical significance and the phenotypes associated with known variants or with the genes affected by the variants, with the variant ID listed for variant associations and the gene ID listed for gene associations, along with the source of the association.
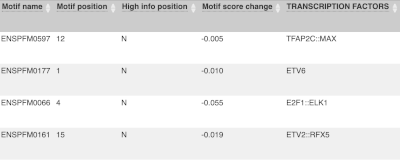
For variants that affect transcription factor binding motifs, there are columns that show the effect on motifs (you may need to click on Show/hide columns at the top left of the table to display these). Here you can see the position of the variant in the motif, if the change increases or decreases the binding affinity of the motif and the transcription factors that bind the motif.
Above the table is the Filter option, which allows you to filter by any column in the table. You can select a column from the drop-down, then a logic option from the next drop-down, then type in your filter to the following box. We’ll try a filter of Consequence, followed by is then missense_variant, which will give us only variants that change the amino acid sequence of the protein. You’ll notice that as you type missense_variant, the VEP will make suggestions for an autocomplete.

You can export your VEP results in various formats, including VCF. When you export as VCF, you’ll get all the VEP annotation listed under CSQ in the INFO column. After filtering your data, you’ll see that you have the option to export only the filtered data. You can also drop all the genes you’ve found into the Gene BioMart, or all the known variants into the Variation BioMart to export further information about them.
Running CFTR variants through VEP
Resequencing of the genomic region of the human CFTR (cystic fibrosis transmembrane conductance regulator (ATP-binding cassette sub-family C, member 7) gene (ENSG00000001626) has revealed the following variants. The alleles defined in the forward strand:
- G/A at 7: 117,530,985
- T/C at 7: 117,531,038
- T/C at 7: 117,531,068
Use the VEP tool in Ensembl and choose the options to see SIFT and PolyPhen predictions. Do these variants result in a change in the proteins encoded by any of the Ensembl genes? Which gene? Have the variants already been found?
Go to the Ensembl homepage and click on the link Tools at the top of the page. Currently there are nine tools listed in that page. Click on Variant Effect Predictor and enter the three variants as below:
7	117530985	117530985	G/A
7	117531038	117531038	T/C
7	117531068	117531068	T/C
Note: Variation data input can be done in a variety of formats. See more details about the different data formats and their structure in this VEP documentation page. Click Run. When your job is listed as Done, click View Results.
You will get a table with the consequence terms from the Sequence Ontology project (http://www.sequenceontology.org/) (i.e. synonymous, missense, downstream, intronic, 5’ UTR, 3’ UTR, etc) provided by VEP for the listed SNPs. You can also upload the VEP results as a track and view them on Location pages in Ensembl. SIFT and PolyPhen are available for missense SNPs only. For two of the entered positions, the variations have been predicted to have missense consequences of various pathogenicity (coordinate 117531038 and 117531068), both affecting CFTR. All the three variants have been already annotated and are known as rs1800077, rs1800078 and rs35516286 in dbSNP (databases, literature, etc).
VEP cdk5r1b Atlantic salmon
We have identified a few variants in Atlantic salmon (Salmo salar):
- chr 28, genomic coordinate 1777645, alleles C/T
- chr 28, genomic coordinate 1777906, alleles G/A
- chr 28, genomic coordinate 1786995, alleles T/G
(a) Which genes and transcripts do these variants map to?
(b) Do these variants result in a change in the proteins encoded by any of the Ensembl genes? Which genes?
Go to www.ensembl.org and click on the Variant Effect Predictor link on the homepage. Click Launch VEP.
Choose Atlantic salmon as the species and copy the following into the Paste data text box:
28 1777645 1777645 C/T var1.
28 1777906 1777906 G/A var2.
28 1786995 1786995 T/G var3.
Note: Variation data input can be done in a variety of formats. See more details here http://www.ensembl.org/info/docs/variation/vep/vep_formats.html
Click Run.
When your job is listed as Done, click View Results.
You will get a table with the consequence terms from the Sequence Ontology project (http://www.sequenceontology.org/) (i.e. synonymous, missense, downstream, intronic, 5’ UTR, 3’ UTR, etc) provided by VEP for the listed SNPs. You can also upload the VEP results as a track and view them on Location pages in Ensembl.
The variants overlaps three genes (six transcripts of psmd11b, four transcripts of cdk5r1b and one transcript of ENSSSAG00000096896 gene)
Variant 28_1777906_G/A overlaps cdk5r1b gene and resulted in amino acid change at position 109 and 116 (Ser to Leu), variant 28_1777645_C/T also overlaps cdk5r1b gene and resulted in amino acid change at position 96 and 203 (Arg to His).
Web VEP analysis of variants in Oryza sativa Japonica (rice)
You’ll find a VCF file here. This is a small subset of the outcome of Oryza sativa Japonica whole-genome sequencing and variant-calling experiment. Analyse the variants in this file with the VEP tool in Ensembl Plants and determine the following:
-
How many genes and transcripts are affected by variants in this file?
-
Do these variants result in a change in the proteins encoded by any of the Ensembl genes? Which genes are affected? What is the amino acid change? What is the pathogenicity prediction score for this change?
Go to Ensembl Plants and click on Tools at the top of the page. Click on Variant Effect Predictor and select Oryza sativa Japonica Group from the Species menu.
Either click on Choose file and select the file to upload it, or directly paste the URL into the Or provide file URL: box. Click Run at the bottom of the page. When your job is done, click View results.
- The number of affected genes and transcripts is shown in the Summary statistics table at the top.
8 genes and 8 transcripts are affected by these variants.
- Use the filters to view only missense variants. The filters are found above the detailed results table in the middle. Select Consequence and is from the drop-down menus. Then type
missense_variantinto the boxe. Add to apply your filter.1 variant is a missense variant. It causes a leucine to arginine (L/R) at position 16 change in the gene OS09G0103500. The SIFT score is 0.01 (Deleterious low confidence). Refere to this link for more information on SIFT (https://sift.bii.a-star.edu.sg/).
Web VEP analysis of variants in Triticum aestivum (wheat)
You have done whole-genome sequencing and variant-calling experiments for Triticum aestivum. You have a VCF file with a small subset of variants from this experiment. Analyse the variants in this file with the VEP tool in Ensembl Plants and determine the following:
-
How many variants were analysed? How many are novel?
-
How many genes and transcripts are affected by variants in this file?
-
Do any of the variants have different consequences for different transcripts?
-
Filter the table to find variants with high impact. How many variants have high impact? Why do you think missense variants are not classified as high impact?
-
Can you export all the results to a VCF file? Compare it to the input VCF file to see what information the VEP adds.
Go to any Ensembl Plants page and click on Tools in the navigation bar at the top of the page. Click on Variant Effect Predictor and change your species to Triticum aestivum by clicking on Change species.
Enter a descriptive name for your VEP job. If you have downloaded the variant file to your local machine, click on Choose file to upload. Alternatively, you can paste the URL for the file into the Or provide file URL: box. Click Run at the bottom of the page. When your job is done, click View reesults.
-
20 variants were analysed, of which 1 is novel.
-
Only 1 gene is affected by variants in this file. The gene has 2 transcripts and both are affected by the variants.
- You can find a list of calculated variant consequences and their impact here.
Yes, the novel variant results in a stop_lost in TraesCS3A02G301400.1 and is a downstream_gene_variant for TraesCS3A02G301400.2.
- Use the filters to view only variants with HIGH impact (you may need to add the column under Show/hide columns at the top of the table if you cannot find it). The filters are found above the detailed results table in the middle. Select Impact and is from the drop-down menus. Then type
HIGHinto the box; this will autocomplete. Click Add.There are 3 variants with high impact and all three are stop altering. Missense variants are not classified as high impact, because they do not always have significant impacts on protein functions. Usually the protein is still produced. In contrast, stop altering variants affect the protein length, and therefore likely affect the protein function.
- At the top right of the table there is an option to download data. Click on VCF for the All option. Open the VCF file you have downloaded in a text editor. You can see that VEP adds annotation in the INFO column of the VCF file.
VEP analysis of variants in Verticillium dahliae
Verticillium wilt caused by Verticillium dahliae is a notorious soil-borne fungal disease that threatens the yield of economic crops worldwide. We have identified four variants in Verticillium dahliae JR2 chromosome 5:
- C->G at 698711
- G->T at 698935
- G->A at 700313
- C->A at 701484
Use VEP in Ensembl Fungi to answer the following questions:
-
Have these variants already been annotated in Ensembl?
-
What genes are affected by the variants? What are their gene IDs?
-
Are any of the variants predicted to be missense variants?
Go to any Ensembl Fungi page and click on Tools in the navigation bar at the top of the page. Click on Variant Effect Predictor and change your species to Verticillium dahliae JR2 by clicking on Change species.
Enter a descriptive name for your VEP job. You will need to convert your variants into one of VEP’s supported input formats. We have converted the variants into the Ensembl default format below. Paste the variants into Input data:.
5 698711 698711 C/G
5 698935 698935 G/T
5 700313 700313 G/A
5 701484 701484 C/A
Click Run at the bottom of the page. When your job is done, click View reesults.
- You can find the number of existing and novel variants in the Summary statistics of the results.
4 variants were analysed, of which 3 are novel.
- You can also find the number of overlapped genes in the Summary statistics.
4 genes are affected.
Sort the table by Gene by clicking on the column name. Count the number of unique gene IDs.
The gene IDs are: VDAG_JR2_Chr5g02150a, VDAG_JR2_Chr5g02160a, VDAG_JR2_Chr5g02170a and VDAG_JR2_Chr5g02171a.
- Filter the table as follows: Consequence
is missense_variant.Yes, the third variant (5_700313_G/A) is predicted to have a missense effect on gene VDAG_JR2_Chr5g02170a.
VEP in Ensembl Bacteria
In Ensembl Bacteria the genome for Bacteroides fragilis 638R and launch the VEP tool. Use VEP to predict the effects of a 7 bp deletion of TCTACAA on the supercontig FQ312004 at the position 258140-258146. Use the results to answer the following questions:
-
How many genes does the indel overlap? What are their gene symbols?
-
What is the most common consequence of the variant?
-
What is the most severe consequence? What gene does it affect and what does it do?
Type Bacteroides fragilis 638R into the species search box, then select the genome. You are now in the species information page. Click on Variant Effect Predictor at the bottom left. Next, you want to make sure your variant is in one of VEP’s supported variant formats. We have converted the variant into the Ensembl default VEP format. You can enter the following into the input box: FQ312004 258140 258146 TCTACAA/- +
Make sure you name your VEP job something descriptive, so it’s easier for you to find later on. Click Run to get the results.
- Find the number of overlapped genes in the Summary statistics. You can find their gene symbols under the Symbol column in the table below.
The indel overlaps 14 different genes. 12 have the following symbols assigned to them: traA, traD, traE, traF, traG, traI, traJ, traK, traL, traM, traN and traO. 2 genes do not have a gene symbol.
- Sort the table by Consequence by clicking on the column name.
The most common consequences are downstream_gene_variant (n=6) and upstream_gene_variant (n=6).
- You can find a list of calculated consequences sorted by severity in the [Ensembl Variation documentation](https://www.ensembl.org/info/genome/variation/prediction/predicted_data.html#consequences).
According to the calculated variant consequence list, the most severe consequence is frameshift_variant on the traI gene. The gene is a putative conjugative transposon protein traI.


