
Filter Events by Year
Ensembl: Bioinformatics and Functional Genomics in Zebrafish
Course Details
- Lead Trainer
- Aleena Mushtaq
- Event Date
- 2022-09-28
- Location
- Virtual
- Description
- Work with the Ensembl Outreach team to get to grips with the Ensembl browser, accessing and analysing Zebrafish genomic data.
Demos and exercises
Ensembl species
The front page of Ensembl is found at ensembl.org. It contains lots of information and links to help you navigate Ensembl:
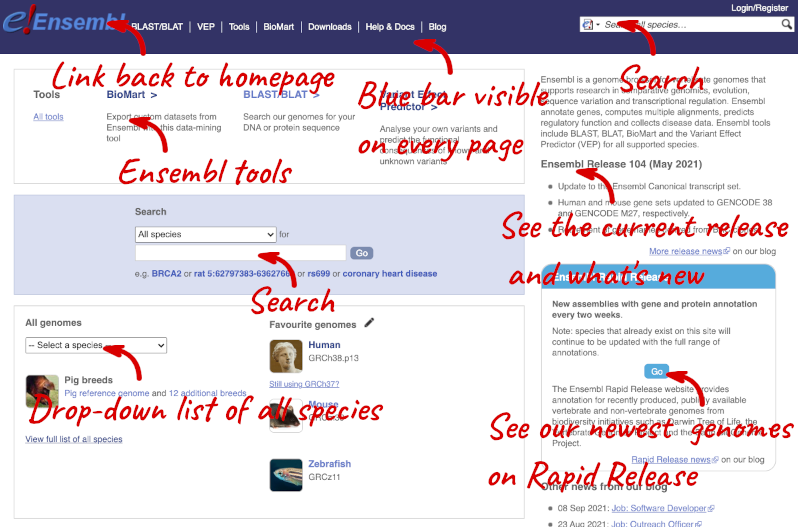
At the top left you can see the current release number and what has come out in this release. To access old releases, scroll to the bottom of the page and click on View in archive site.
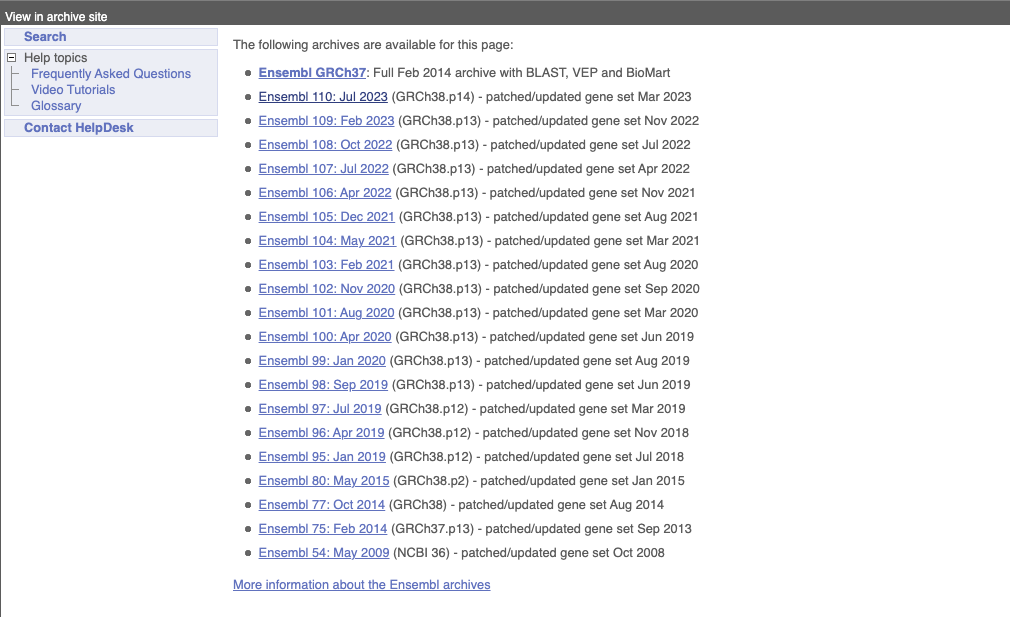
Click on the links to go to the archives. Alternatively, you can jump quickly to the correct release by putting it into the URL, for example e98.ensembl.org jumps to release 98.
Click on View full list of all species.
Click on the common name of your species of interest to go to the species homepage. We’ll click on Zebrafish.
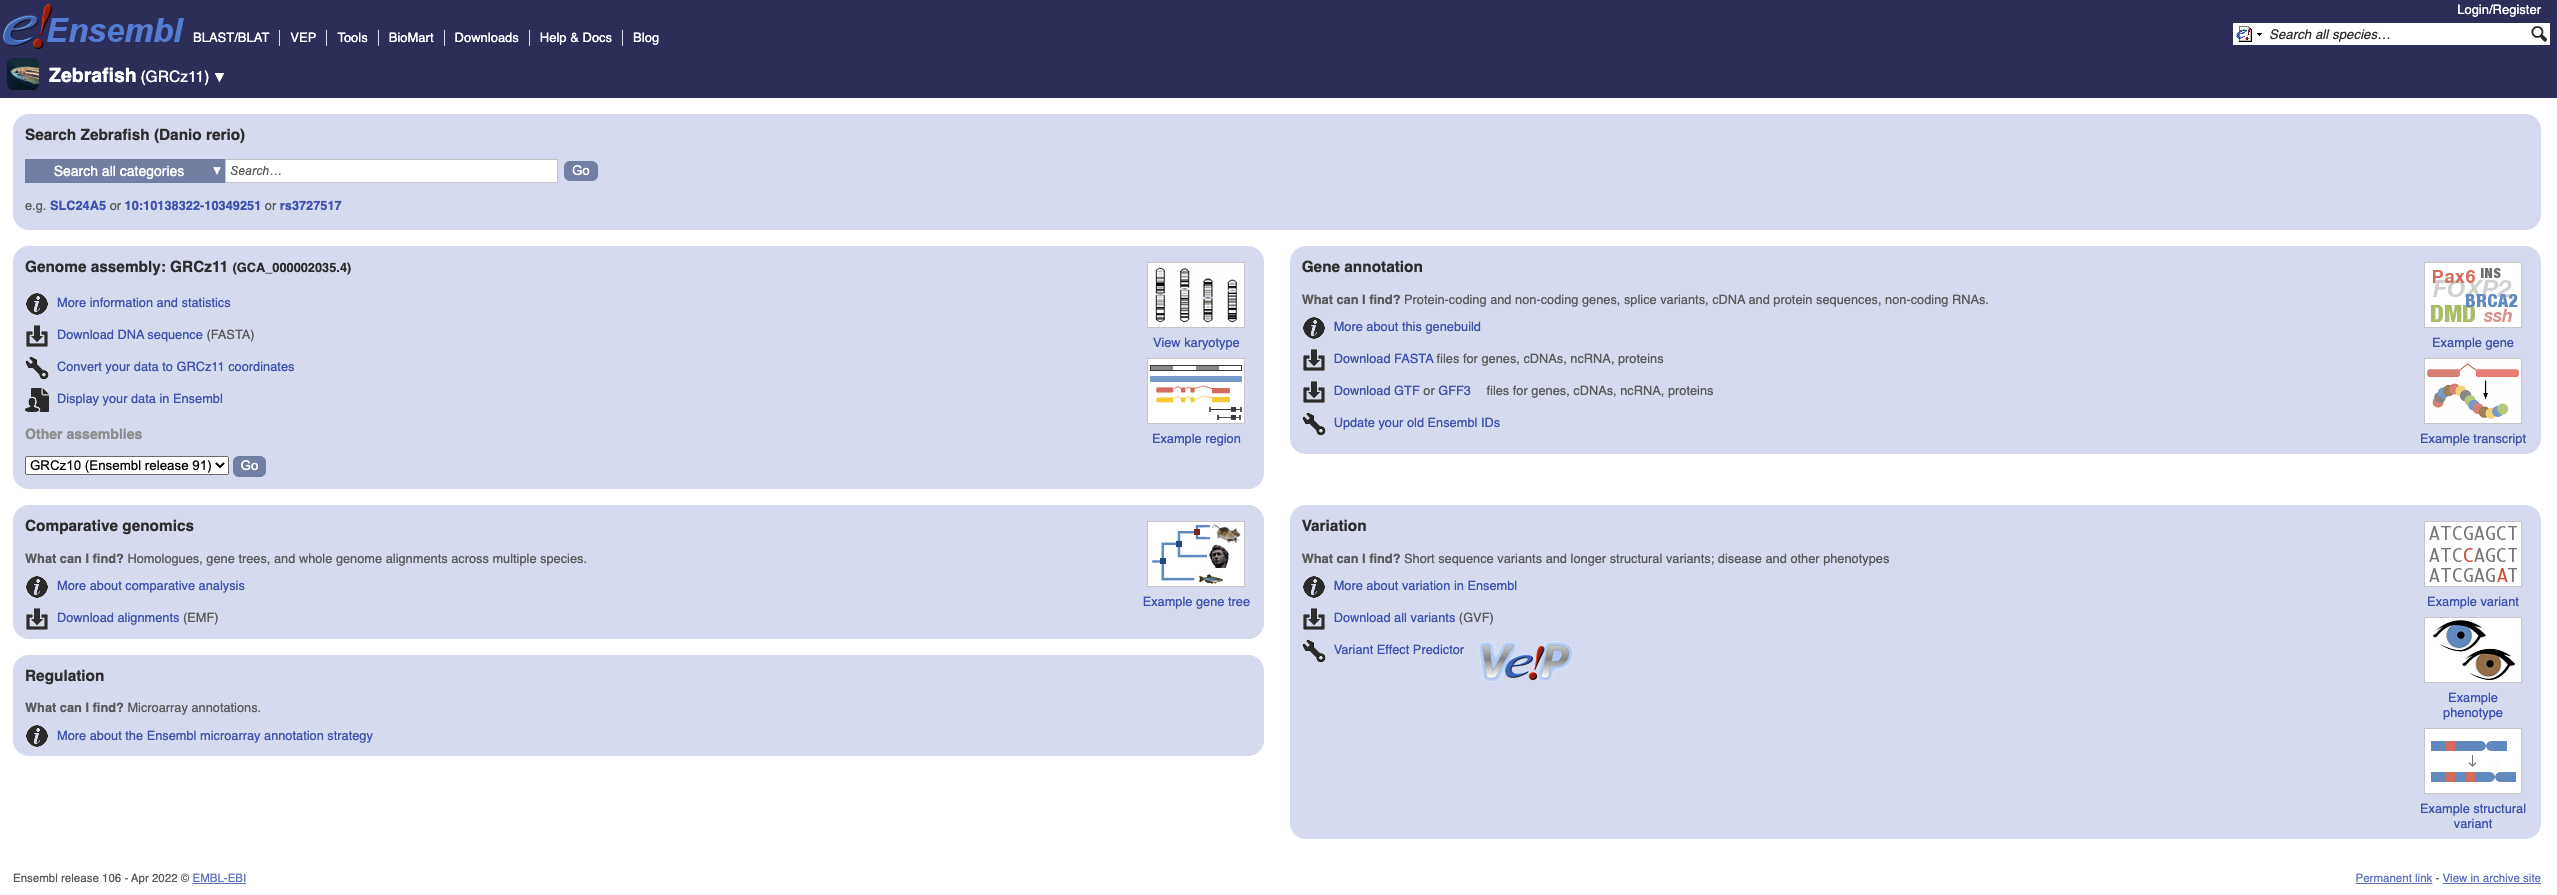
Here you can see links to example pages and to download flatfiles. To find out more about the genome assembly and genebuild, click on More information and statistics.
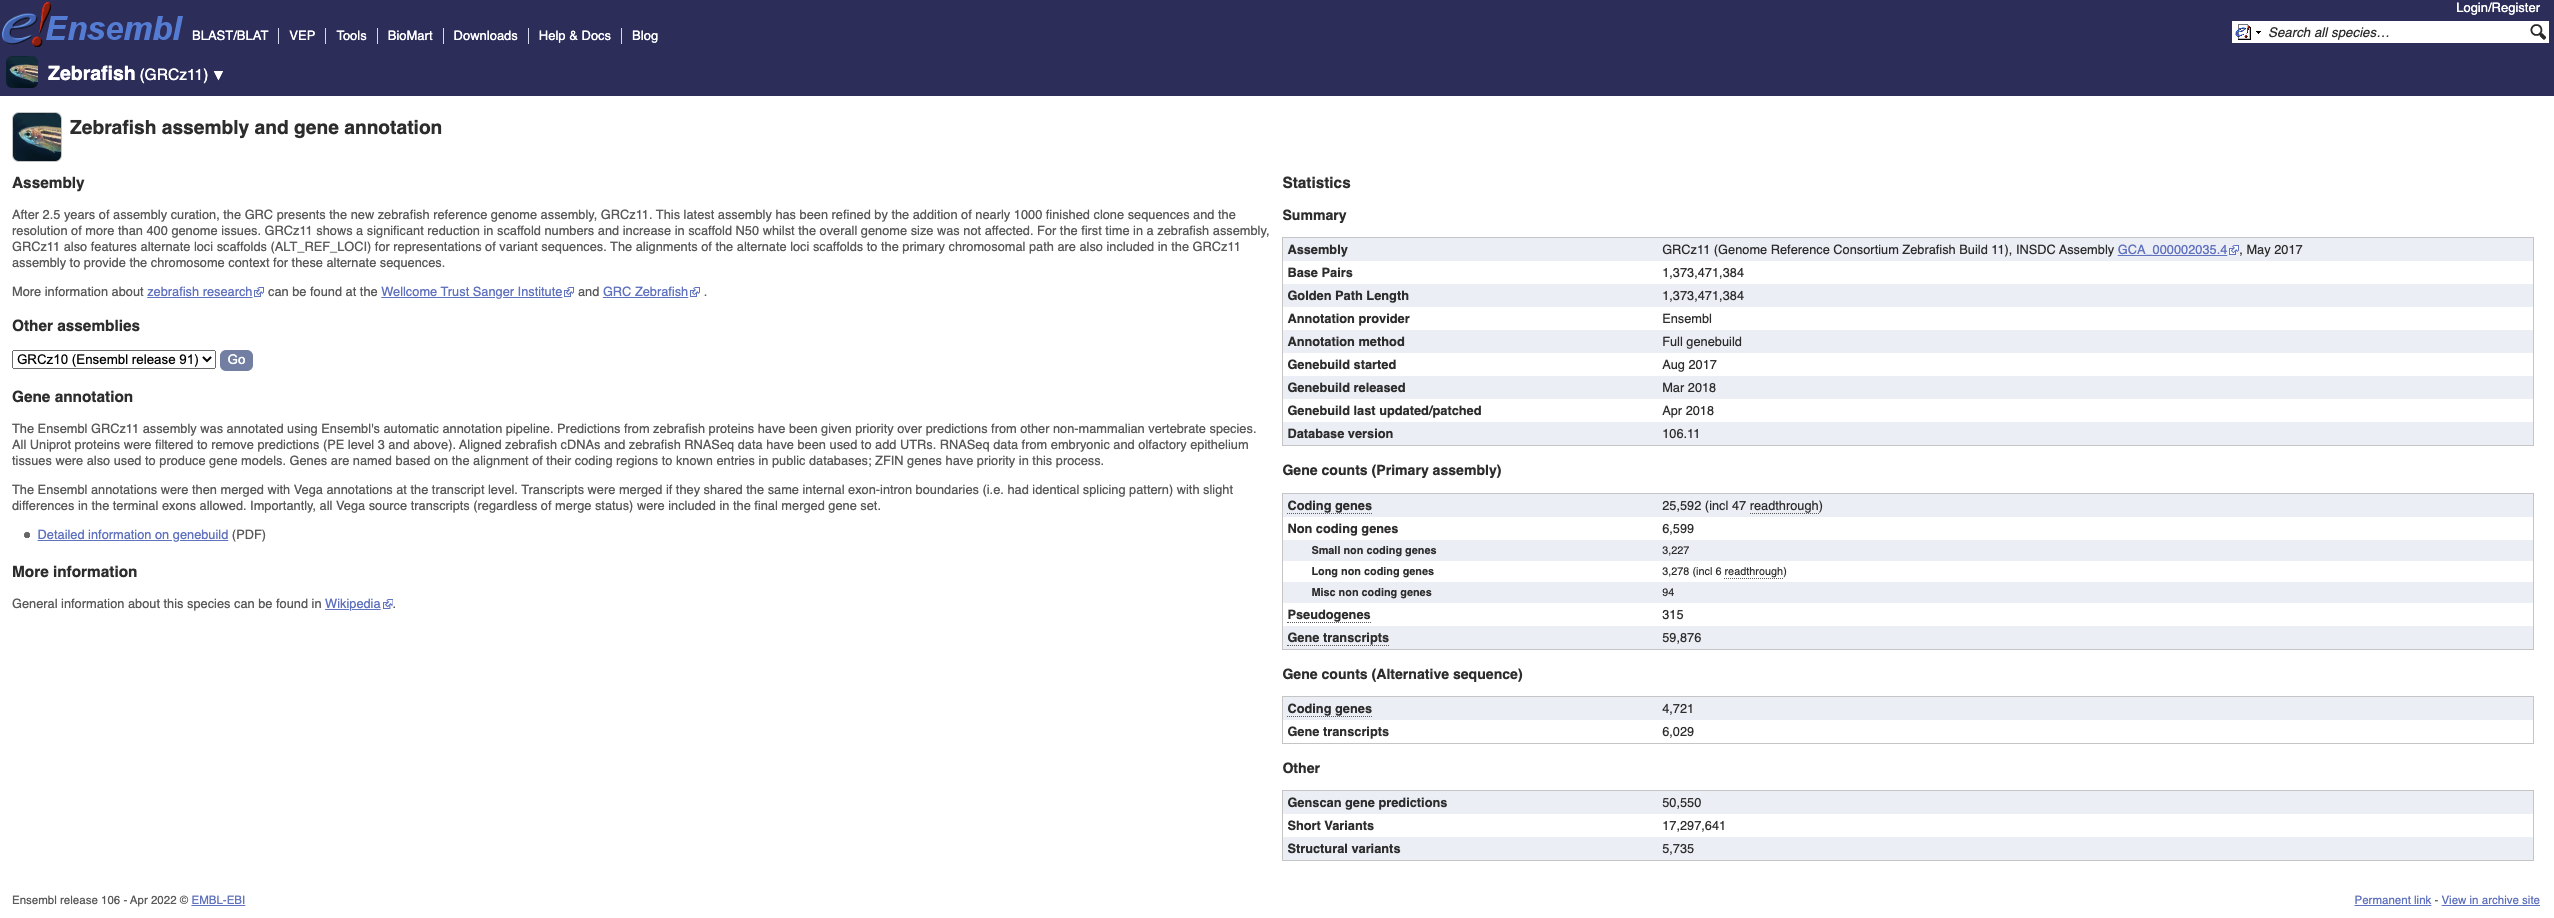
Here you’ll find a detailed description of how to the genome was produced and links to the original source. You will also see details of how the genes were annotated.
Available zebrafish assemblies
What previous assemblies are available for zebrafish?
Click on Zebrafish on the front page of Ensembl to go to the species homepage. Under Other assemblies three previous assembly names and the releases you can find them in are listed.
Assembly GRCz10 is available in the archived release 80, Zv9 in 77 and Zv8 in 54.
Hagfish
(a) Go to the species homepage for Hagfish. What is the name of the genome assembly?
(b) Click on More information and statistics. Who submitted the Hagfish genome assembly? What was the submission date?
(c) How long is the Hagfish genome (in bp)? How many coding genes have been annotated?
(a) Select Hagfish from the drop down species list, or click on View full list of all Ensembl species, then choose Hagfish from the list. The assembly is Eburgeri_3.2 or GCA_900186335.2.
(b) Click on More information and statistics. The genome was submitted by the Riken Center For Development Biology on 24/10/17.
(c) Genome length and gene number statistics are shown in the tables on the left. The length of the genome is 2,608,383,542 bp. There are 16,513 coding genes.
Poecilia
How many fish are there of the genus Poecilia?
Go to View full list of all Ensembl species, then type Poecilia into the Filter box at the top right of the table. There are four fish of the genus Poecilia (Poecilia formosa, Poecilia reticulata, Poecilia latipinna, Poecilia mexicana).
Region in detail
Start at the Ensembl front page, ensembl.org. You can search for a region by typing it into a search box, but you have to specify the species.
To bypass the text search, you need to input your region coordinates in the correct format, which is chromosome, colon, start coordinate, dash, end coordinate, with no spaces for example: zebrafish 14:548000-578000. Type (or copy and paste) these coordinates into either search box.
Press Enter or click Go to jump directly to the Region in detail Page.
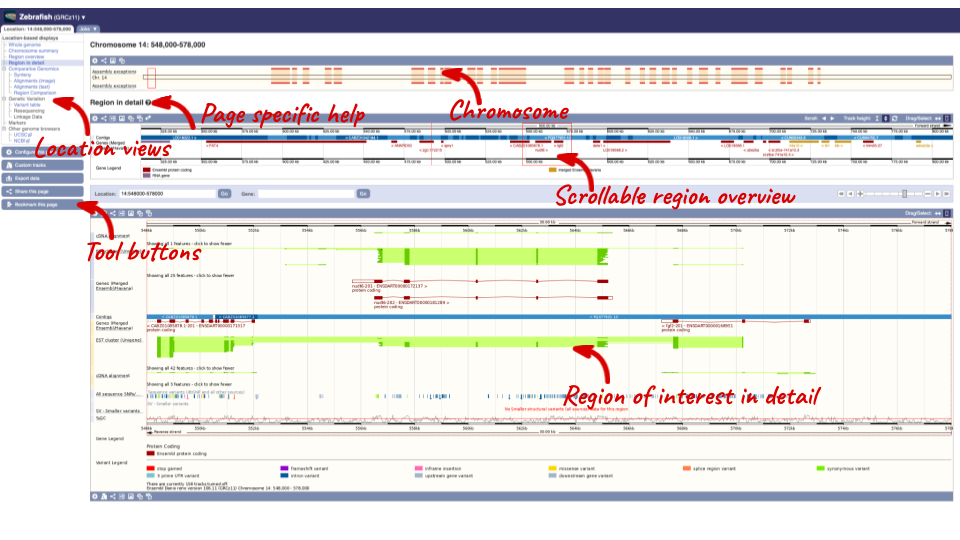
Click on the  button to view page-specific help. The help pages provide text, labelled images and, in some cases, help videos to describe what you can see on the page and how to interact with it.
The Region in detail page is made up of three images, let’s look at each one in detail.
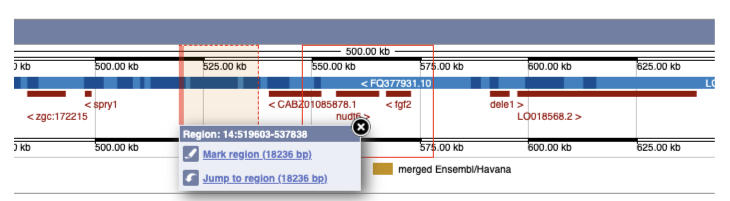
- The first image shows the chromosome:
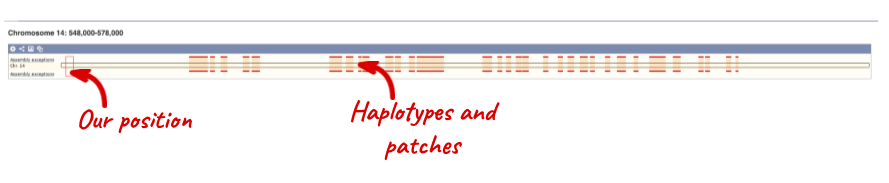
The region we’re looking at is highlighted on the chromosome. You can jump to a different region by dragging out a box in this image. Drag out a box on the chromosome, a pop-up menu will appear.
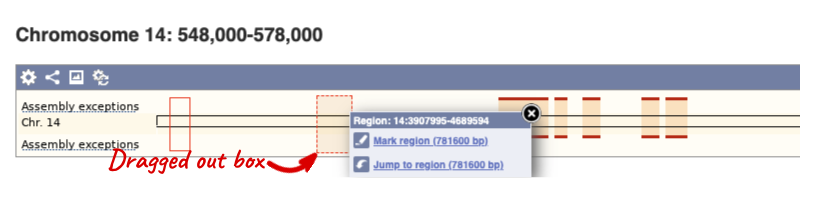
If you wanted to move to the region, you could click on Jump to region (### bp). If you wanted to highlight it, click on Mark region (###bp). For now, we’ll close the pop-up by clicking on the X on the corner.
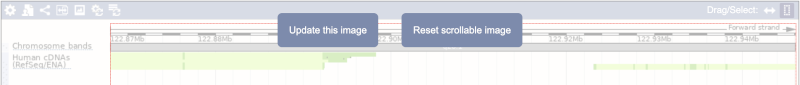
- The second image shows a 1Mb region around our selected region. This is always 1Mb in human, but the fixed size of this view varies between species. This view allows you to scroll back and forth along the chromosome.
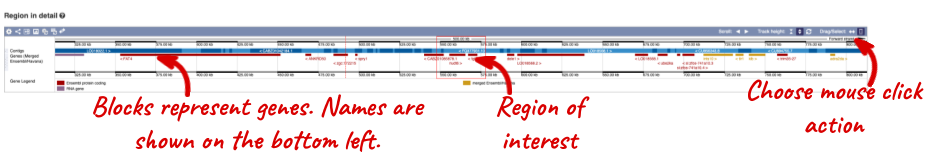
You can also drag out and jump to or mark a region.
Click on the X to close the pop-up menu.
Click on the Drag/Select button  to change the action of your mouse click. Now you can scroll along the chromosome by clicking and dragging within the image. As you do this you’ll see the image below grey out and two blue buttons appear. Clicking on Update this image would jump the lower image to the region central to the scrollable image. We want to go back to where we started, so we’ll click on Reset scrollable image.
- The third image is a detailed, configurable view of the region.
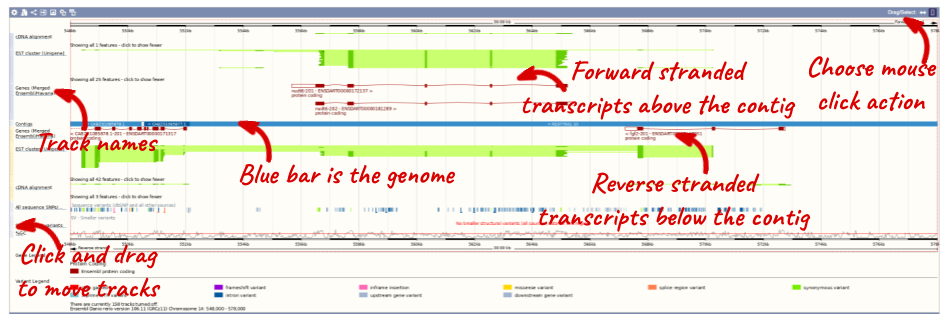
Here you can see various tracks, which is what we call a data type that you can plot against the genome. Some tracks, such as the transcripts, can be on the forward or reverse strand. Forward stranded features are shown above the blue contig track that runs across the middle of the image, with reverse stranded features below the contig. Other tracks, such as variants, regulatory features or conserved regions, refer to both strands of the genome, and these are shown by default at the very top or very bottom of the view.
You can use click and drag to either navigate around the region or highlight regions of interest, Click on the Drag/Select option at the top or bottom right to switch mouse action. On Drag, you can click and drag left or right to move along the genome, the page will reload when you drop the mouse button. On Select you can drag out a box to highlight or zoom in on a region of interest.
With the tool set to Select, drag out a box around an exon and choose Mark region.
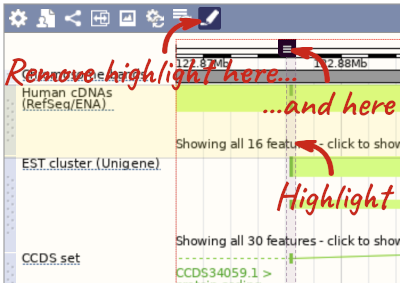
The highlight will remain in place if you zoom in and out or move around the region. This allows you to keep track of regions or features of interest.
We can edit what we see on this page by clicking on the blue Configure this page menu at the left.

This will open a menu that allows you to change the image.
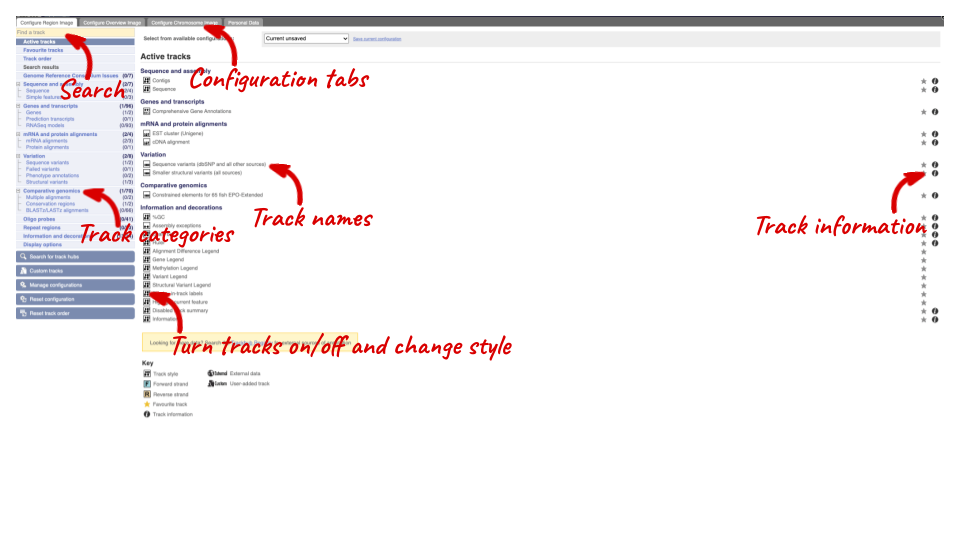
There are many possible tracks that you can add. When you launch the view, you will see all the tracks that are currently turned on with their names on the left and an info icon on the right, which you can click on to expand the description of the track. Turn them on or off, or change the track style by clicking on the box next to the name. More details about the different track styles are in this FAQ: http://www.ensembl.org/Help/Faq?id=335.
You can find more tracks to add by either exploring the categories on the left, or using the Find a track option at the top left. Type in a word or phrase to find tracks with it in the track name or description.
Let’s add some tracks to this image. Add:
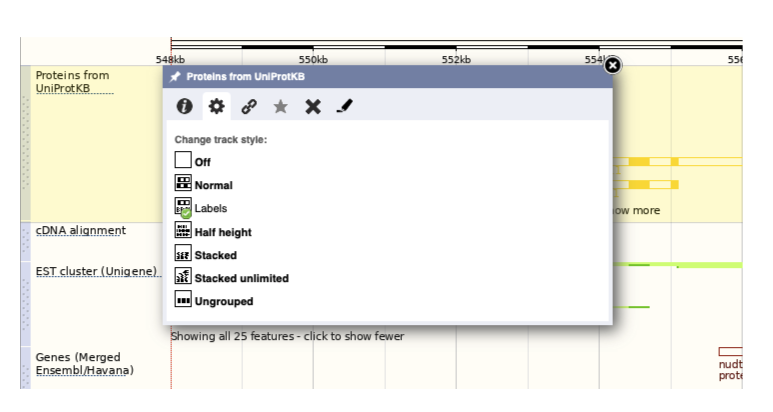
- Proteins from UniProt – Labels
- dbSNP variants – Normal
Now click on the tick in the top left hand to save and close the menu. Alternatively, click anywhere outside of the menu. We can now see the tracks in the image. The proteins track is stranded, so you will see two tracks, one above and one below the contig, representing the proteins mapped to the forward and reverse strands respectively. The variants track is not stranded, so is found near the bottom of the image.
If the track is not giving you can information you need, you can easily change the way the tracks appear by hovering over the track name then the cog wheel to open a menu. To make it easier to compare information between tracks, such as spotting overlaps, you can move tracks around by clicking and dragging on the bar to the left of the track name.
Now that you’ve got the view how you want it, you might like to show something you’ve found to a colleague or collaborator. Click on the Share this page button to generate a link. Email the link to someone else, so that they can see the same view as you, including all the tracks you’ve added. These links contain the Ensembl release number, so if a new release or even assembly comes out, your link will just take you to the archive site for the release it was made on.

To return this to the default view, go to Configure this page and select Reset configuration at the bottom of the menu.
Exploring a genomic region in zebrafish
(a) Go to the region from 54,400,000 to 54,900,000 bp on Danio rerio chromosome 7. How many contigs make up this region?
(b) Zoom in on the gene fgf4.
(c) Configure this page to turn on the Type II transposons track in this view. What tool was used to annotate the LTRs according to the track information? How many LTRs can you see within the fgf4 gene? Do any overlap exons?
(d) Create a Share link for this display. Email it to your neighbour. Open the link they sent you and compare. If there are differences, can you work out why?
(e) Export the genomic sequence of the region you are looking at in FASTA format.
(f) Reset the track configuration you changed in the Region in detail page.
(a) Go to the Ensembl homepage.
Select Search: Zebrafish and type 7:54400000-54900000 in the text box (or alternatively leave the Search drop-down list like it is and type zebrafish 7:54400000-54900000 in the text box). Click Go.
This genomic region is made up of five contigs, indicated by the alternating light and dark blue coloured bars in the Contigs track.
(b) Draw with your mouse a box encompassing the fgf4 transcripts. Click on Jump to region in the pop-up menu.
(c) Click Configure this page in the side menu (or on the cog wheel icon in the top left hand side of the bottom image).
Go into Repeats in the left-hand menu then select Type II transpoons. Click on the (i) button to find out more
Repeat Masker was used to annotate type II transpoons onto the genome.
Save and close the new configuration by clicking on ✓ (or anywhere outside the pop-up window).
There is one type II transposon in an intron of fgf4.
(d) Click Share this page in the side menu. Select the link and copy. Get your neighbour’s email address and compose an email to them, paste the link in and send the message.
When you receive the link from them, open the email and click on your link. You should be able to view the page with the new configuration and data tracks they have added to in the Location tab. You might see differences where they specified a slightly different region to you, or where they have added different tracks.
(e) Click Export data in the side menu. Leave the default parameters as they are. Click Next>. Click on Text.
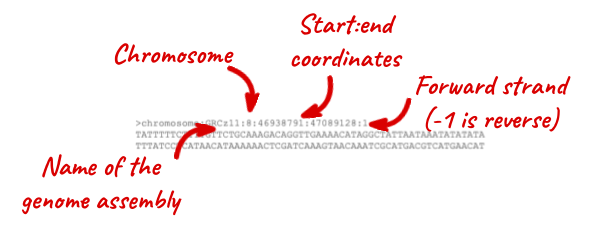
Note that the sequence has a header that provides information about the genome assembly (GRCz11), the chromosome, the start and end coordinates and the strand. For example:
chromosome:GRCz11:7:54617363:54634986:1
(f) Click Configure this page in the side menu. Click Reset configuration. Click ✓.
Exploring repeats
You want to look at some repeat regions in zebrafish 11:23080000-23135000. Go to that region in Ensembl
(a) Turn on the LTR repeat track. How many LTR repeat sites can you see in this locus?
(b) How long is the longest LTR? What is its name?
(c) Mark the region of the longest LTR. Do you notice anything about the density of any other tracks in this region? Why do you think this is?
(a) Go to the Ensembl homepage (http://www.ensembl.org/).
Select Search: zebrafish and type 11:23080000-23135000 in the text box (or alternatively leave the Search drop-down list like it is and type zebrafish 11:23080000-23135000 in the text box). Click Go.
Click Configure this page.
Click on Repeats regions in the left hand menu. Select LTR (repeats (Zebrafish)) in Expanded. There are nine LTR sites in this region.
(b) Click on the longest repeat to get a pop-up. It is 3814 bp long and is called Gypsy107-I_Dr.
(c) Click and drag a box around the site, then select Mark region. There are no SNPs found in this region. This is likely down to the difficulty of calling SNPs in repeat regions which are longer than NGS sequence reads.
Genes and Transcripts
Demo: The gene tab
If you click on any one of the transcripts in the Region in detail image, a pop-up menu will appear, allowing you to jump directly to that gene or transcript.
![]()
Another way to go to a gene of interest is to search directly for it.
We’re going to look at the zebrafish espn gene. This gene encodes a multifunctional actin-bundling protein with a major role in mediating sensory transduction in various mechanosensory and chemosensory cells. Mutations in this gene are associated with deafness in humans.
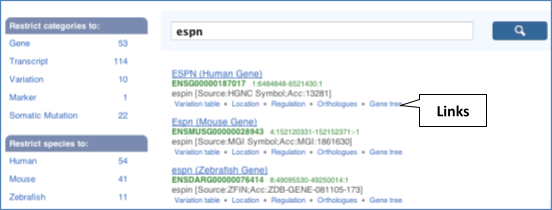
From ensembl.org, type espn into the search bar and click the Go button. You will get a list of hits with the human gene at the top.
Where you search for something without specifying the species, or where the ID is not restricted to a single species, the most popular species will appear first, in this case, human, mouse and zebrafish appear first. You can restrict your query to species or features of interest using the options on the left.
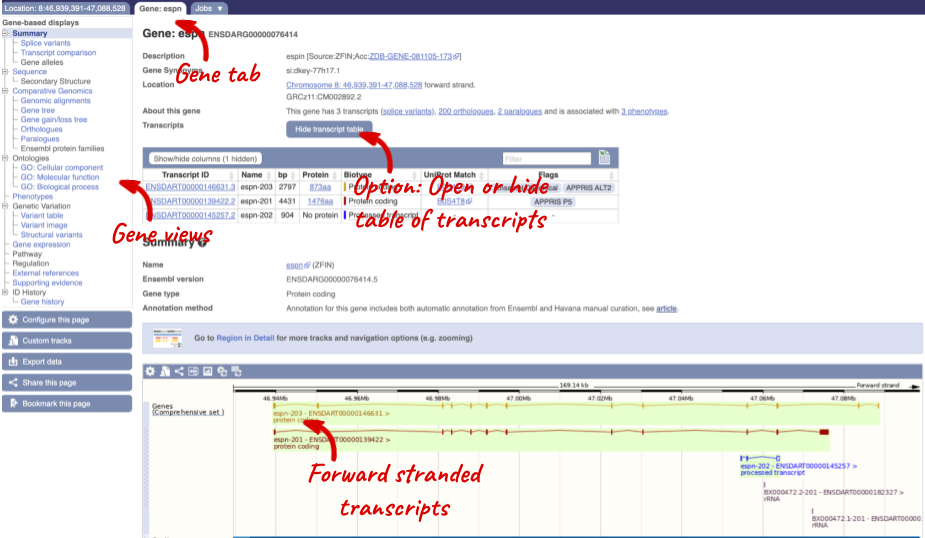
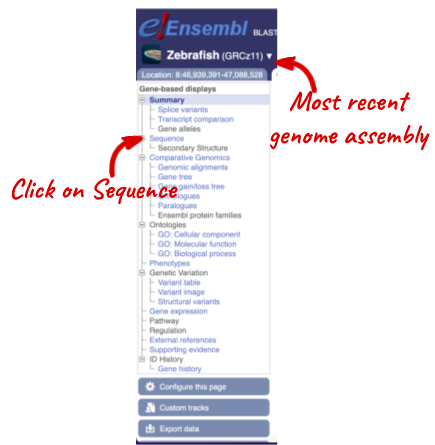
Click on the gene name of the zebrafish gene. The Gene tab should open:
Let’s walk through some of the links in the left hand navigation column. How can we view the genomic sequence? Click Sequence at the left of the page.
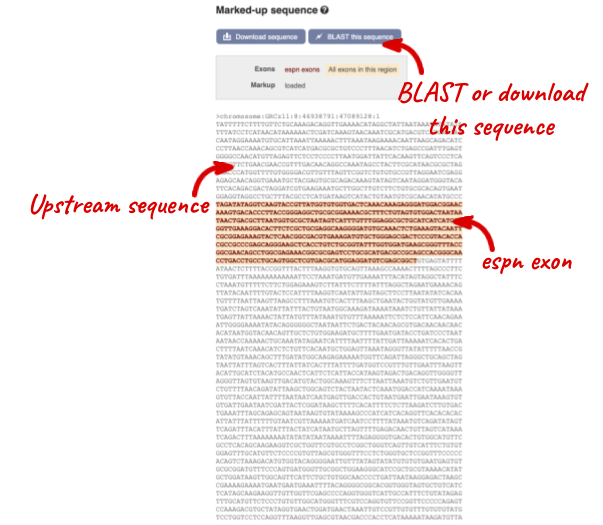
The sequence is shown in FASTA format. Take a look at the FASTA header:
Exons are highlighted within the genomic sequence. Variants can be added with the Configure this page link found at the left. Click on it now.
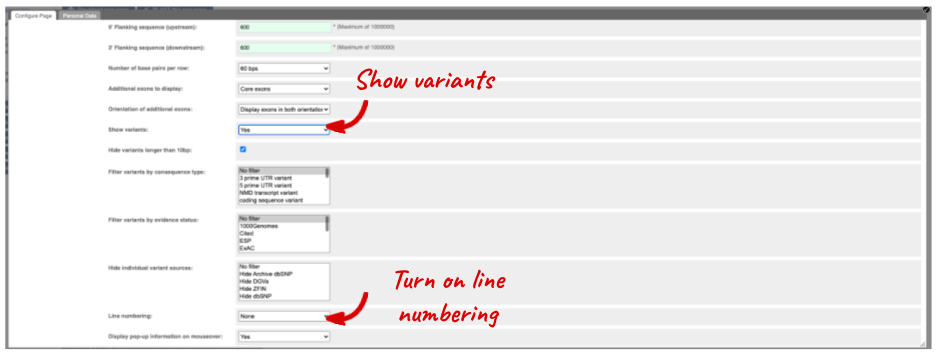
Once you have selected changes (in this example, Show variants and Line numbering) click at the top right.
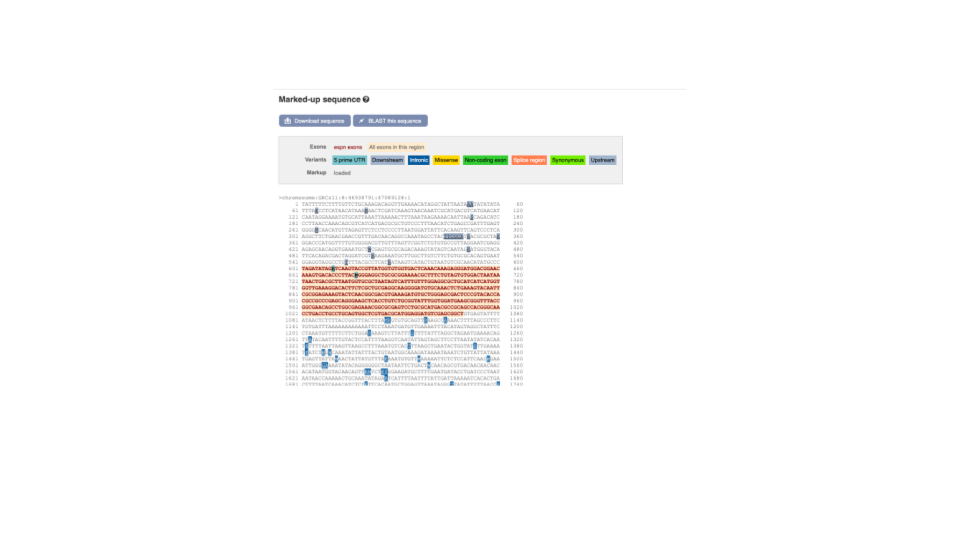
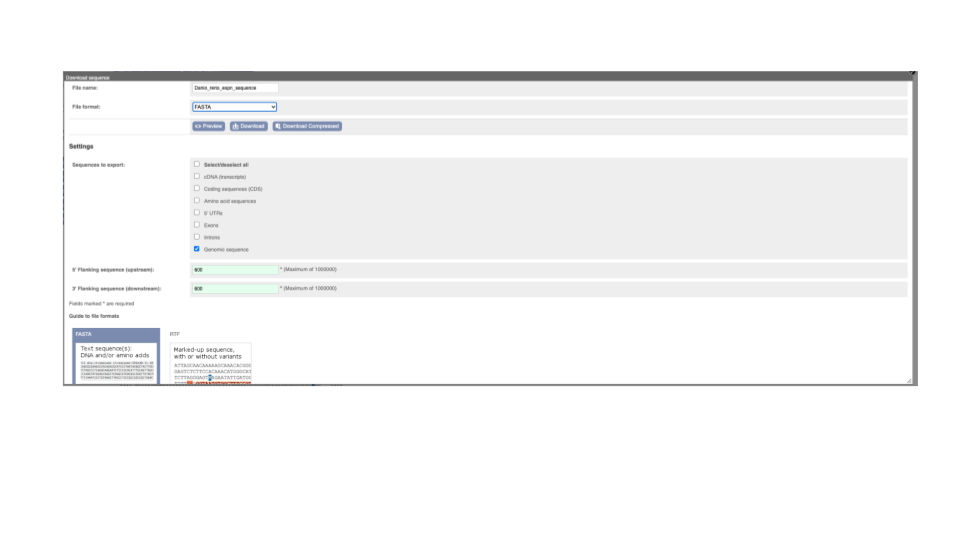
You can download this sequence by clicking in the Download sequence button above the sequence:

This will open a dialogue box that allows you to pick between plain FASTA sequence, or sequence in RTF, which includes all the coloured annotations and can be opened in a word processor. This button is available for all sequence views.
Can our gene be found in other databases? Go up the left-hand menu to External references:
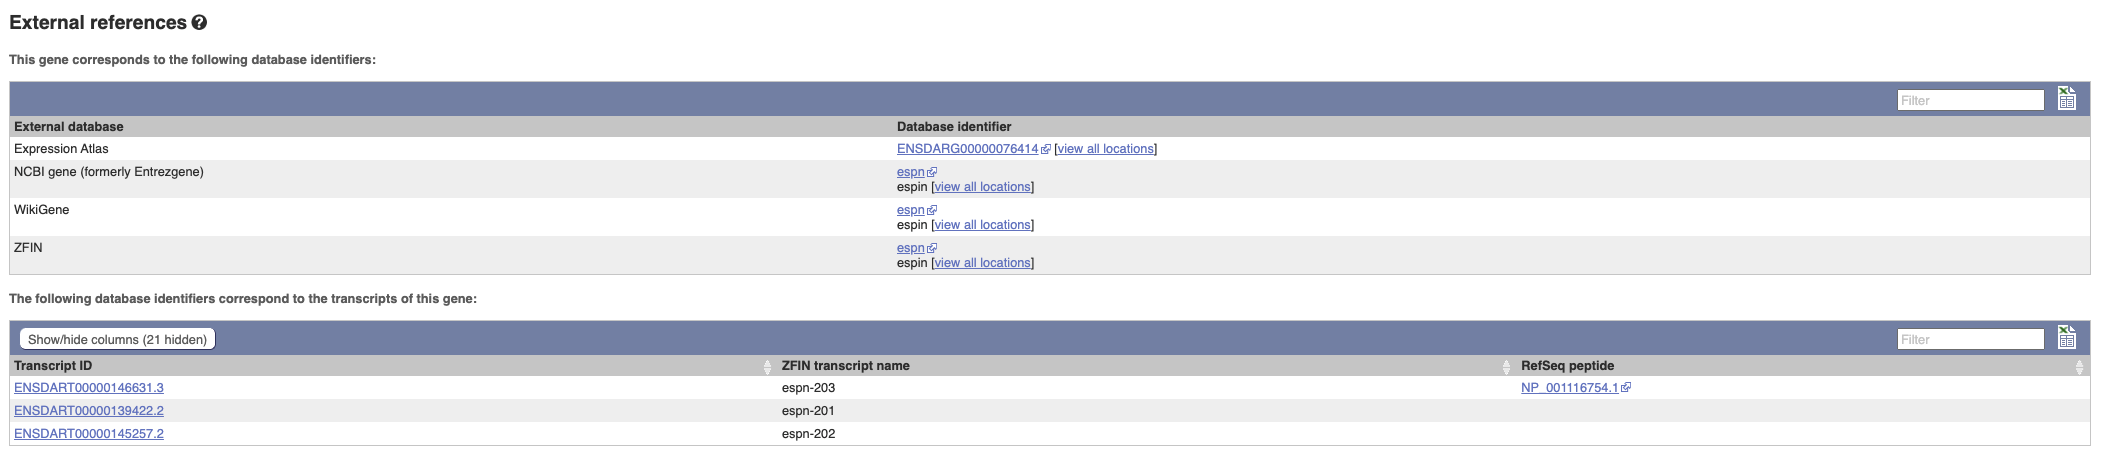
This contains links to the gene in other projects, such as NCBI Gene, and papers where this sequence is published.
To find out what the protein does, click on GO:biological process to see GO terms from the Gene Ontology consortium.
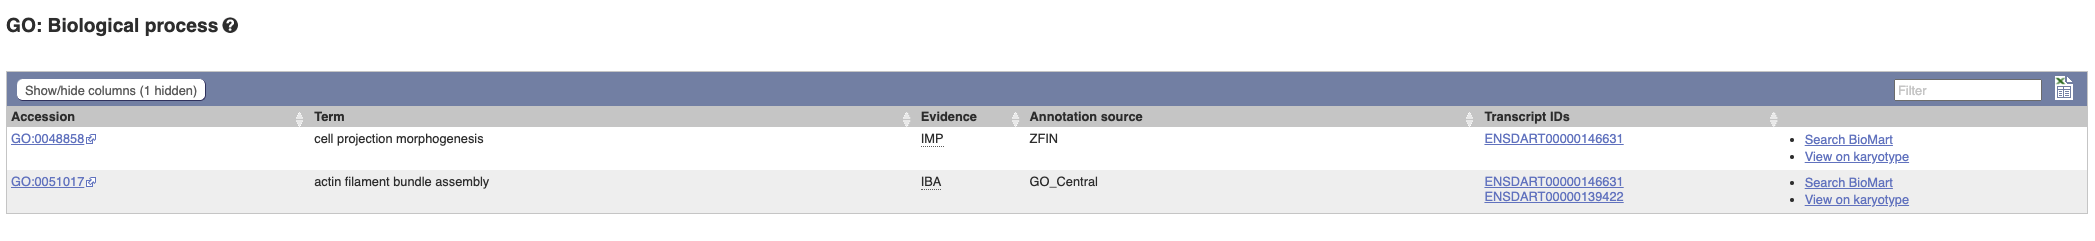
Hover over the three-letter Evidence codes to find out what they mean.
Demo: The transcript tab
Let’s now explore one splice isoform. Click on Show transcript table at the top.

Click on the ID for espn-203, ENSDART00000146631.3.
You are now in the Transcript tab for espn-203. The left hand navigation column provides several options for the transcript espn-203.
For detailed information on the support for this transcript, click on Supporting evidence
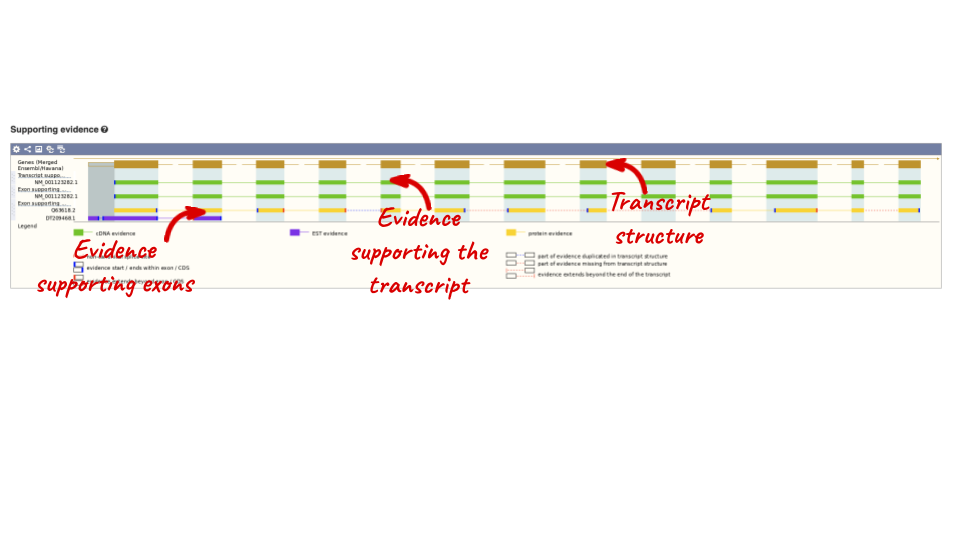
Click on the identifiers of the evidence to get a pop-up. This links out to the original records of these data in, for example, RefSeq, Uniprot or ENA.
Click on the _Exons _link.
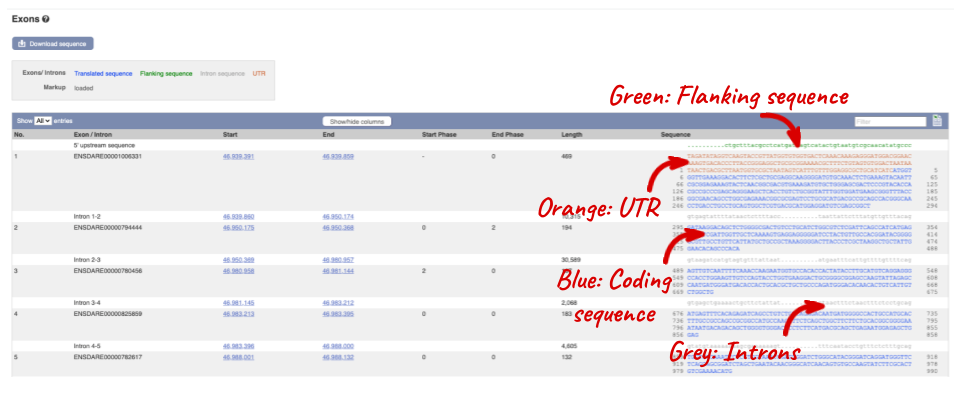
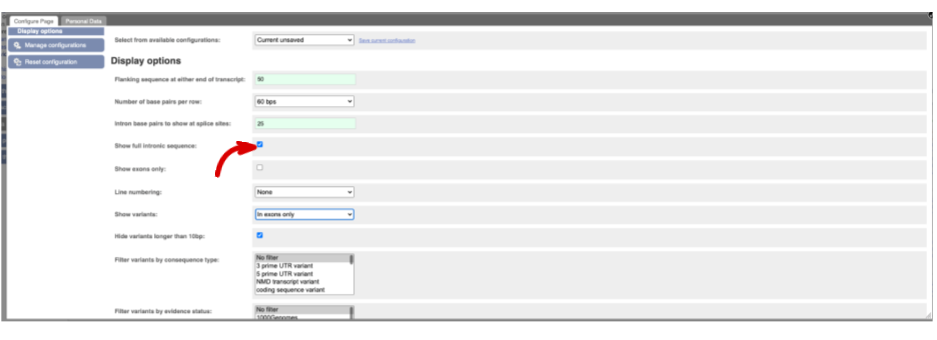
You may want to change the display (for example, to show more flanking sequence, or to show full introns). In order to do so click on Configure this page and change the display options accordingly.
Now click on the_ cDNA_ link to see the spliced transcript sequence.
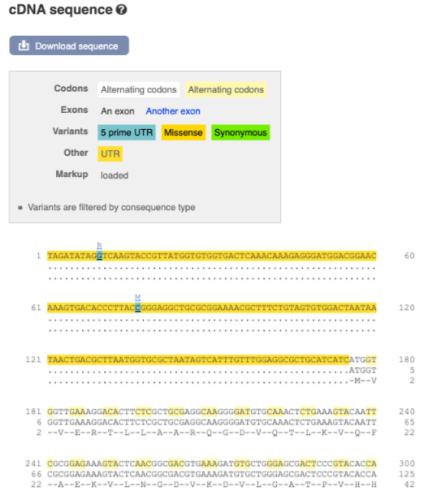
UnTranslated Regions (UTRs) are highlighted in dark yellow, codons are highlighted in light yellow, and exon sequence is shown in black or blue letters to show exon divides. Sequence variants are represented by highlighted nucleotides and clickable IUPAC codes are above the sequence.
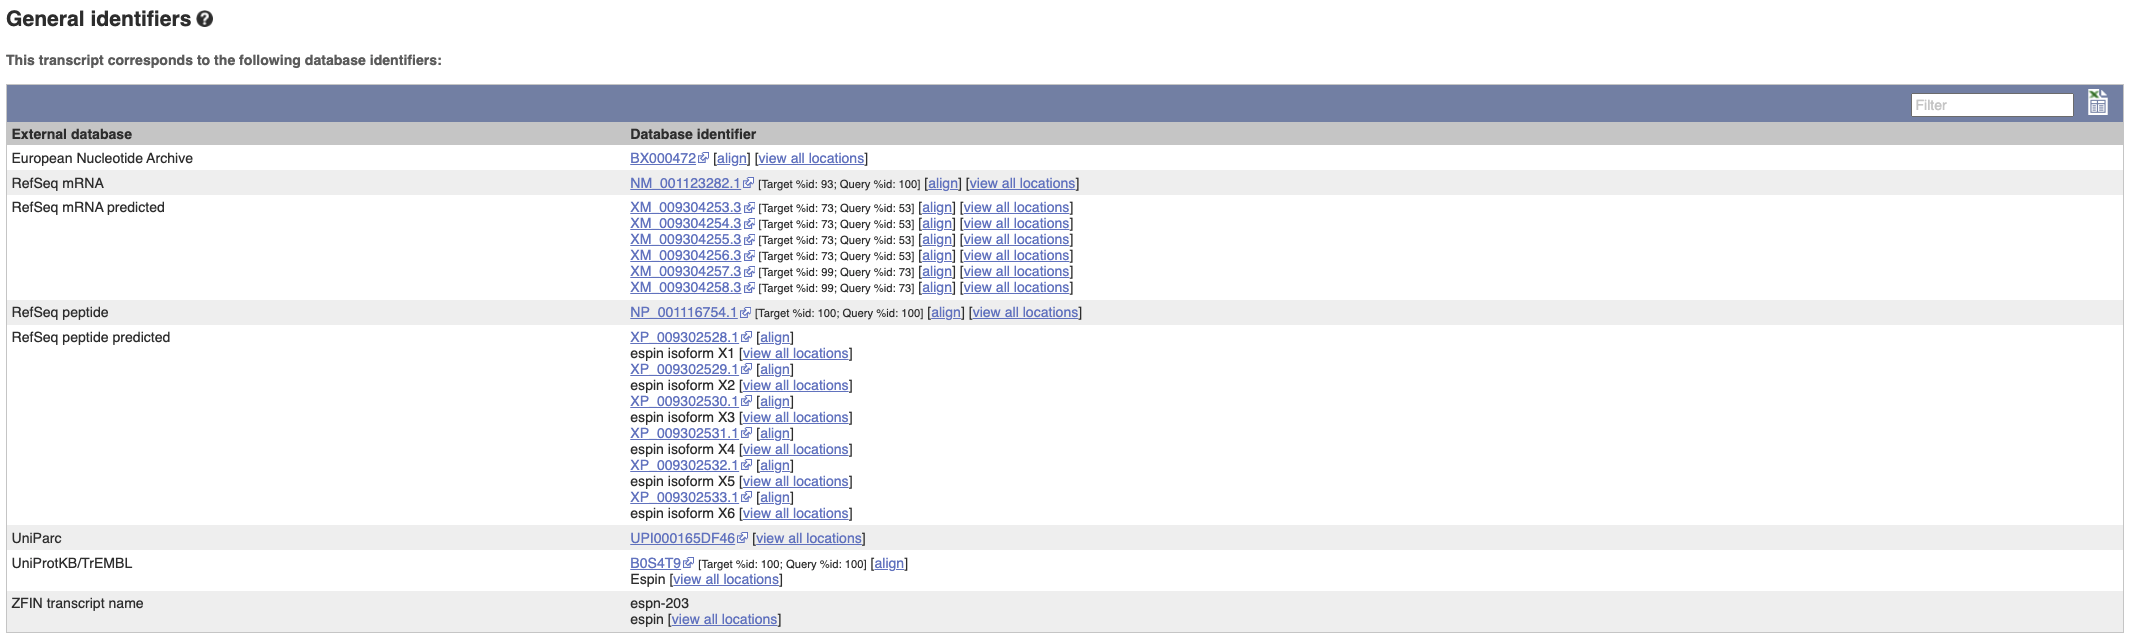
Next, follow the General identifiers link at the left.
This page shows information from other databases such as RefSeq, UniProtKB and others, that match to the Ensembl transcript and protein.
Now click on Protein summary to view domains from Pfam, PROSITE, Superfamily, InterPro, and more.
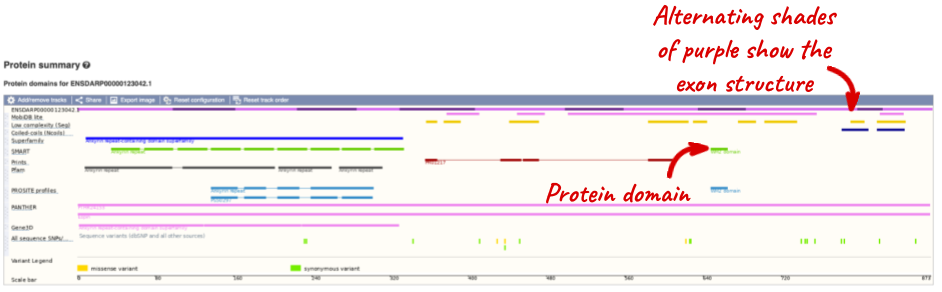
Clicking on Domains & features shows a table of this information.
Exploring the zebrafish vegfaa gene
(a) Find the zebrafish vegfaa (vascular endothelial growth factor Aa) gene, and go to the Gene tab.
- On which chromosome and which strand of the genome is this gene located?
- How many transcripts (splice variants) are there and how many are protein coding?
- How long is the protein encoded by ENSDART00000167719.2?
- What are some functions of vegfaa according to the Gene Ontology consortium?
(b) Click on Phenotype at the left side of the page. Are there any diseases or traits associated with this gene? Is the human orthologue of vegfaa associated with any diseases, according to MIM (Mendelian Inheritance in Man)?
(c) In the transcript table, click on the transcript ID for vegfaa-201, and go to the Transcript tab.
- How many exons does it have?
- Are any of the exons completely or partially untranslated?
- Is there an associated sequence in UniProtKB/SwissProt? Have a look at the General identifiers for this transcript.
(d) Are there microarray (oligo) probes that can be used to monitor ENSDART00000167719 expression?
(a) Go to the Ensembl homepage.
Select Search: Zebrafish and type vegfaa. Click Go.
Click on the Ensembl ID ENSDARG00000103542.
- Chromosome 16 on the reverse strand.
- Ensembl has one transcript annotated for this gene, which is protein coding.
- It codes for a protein of 188 amino acids
Click on GO:molecular function to see that growth factor activity and heparin binding are associated with vegfaa.
(b) Click on Phenotype at the left side of the page. Scroll down to see phenotypes associated with orthologues. You may find it easier to use the filter box at the top right to narrow down to MIM or human.
This gene is associated with MICROVASCULAR COMPLICATIONS OF DIABETES, SUSCEPTIBILITY TO, 1 in human.
(c) Click on ENSDART00000167719.2.
It has seven exons. This is shown in the Transcript summary or in the left hand side menu Exons.
Click on the Exons link in this side menu.
Exons 1 and 7 are partially untranslated (UTR sequence is shown in red). You can also see this in the cDNA view if you click on the cDNA link in the left side menu.
O73682 from UniProt/Swiss-Prot matches the translation of the Ensembl transcript. Click on O73682 to go to UniProtKB, or click align for the alignment.
(d) Click on Oligo probes in the side menu.
Probesets from AFFY Zebrafish, AGILENT, AFFY ZebGene and NIMBLEGEN GPL match to this transcript sequence. Expression analysis with any of these probesets would reveal information about the transcript. Hint: this information can sometimes be found in ArrayExpress
Exploring the zebrafish prkci gene
Search for the zebrafish gene prkci.
(a) What GO: biological process terms are associated with the prkci gene?
(b) Go to the transcript tab for the only protein coding transcript. How many exons does it have? Which one is the longest? How much of that is coding?
(c) How many different domain prediction methods predict a PB1 domain? Where in the protein is this domain?
(a) Go to the Ensembl homepage (http://www.ensembl.org).
Select Search: Zebrafish and type prkci. Click Go. Click on the gene link ENSDARG00000021225.
Click on GO: biological process in the side menu. Protein phosphorylation is listed as GO: Biological process associated with this gene.
(b) Click on the transcript ENSDART00000015723.8. Click on Exons in the left hand menu. There are eighteen exons. Exon 18 is longest with 1,596 bp, of which around 95 are coding.
(c) Click on either Protein Summary or Domains & features in the left hand menu to see graphically or as a table respectively. The PB1 domain is predicted by SMART, Pfam and PROSITE. It is towards the N-terminus of the protein. Clicking on the predicted PB1 domain will open a pop-up window that shows you the amino acid coordinates for the predicted domain.
Variation
In any of the sequence views shown in the Gene and Transcript tabs, you can view variants on the sequence. You can do this by clicking on Configure this page from any of these views.
Let’s take a look at the Gene sequence view for smc3 in zebrafish. Search for smc3 and go to the Sequence view.
If you can’t see variants marked on this view, click on Configure this page and select Show variants: Yes and show links.

Find out more about a variant by clicking on it.

You can go to the Variation tab by clicking on the variant ID. For now, we’ll explore more ways of finding variants.
To view all the sequence variations in table form, click the Variation table link at the left of the gene tab.
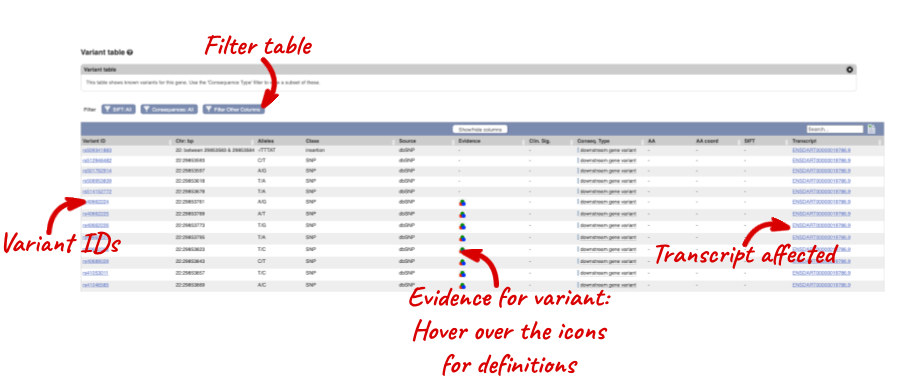
You can filter the table to only show the variants you’re interested in. For example, click on Type: All, then select the variant consequences you’re interested in.
The table contains lots of information about the variants. You can click on the IDs here to go to the Variation tab too.
You can also see the phenotypes associated with a gene. Click on Phenotype in the left hand menu.
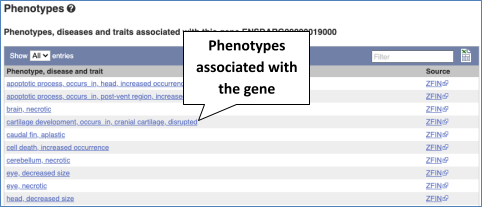
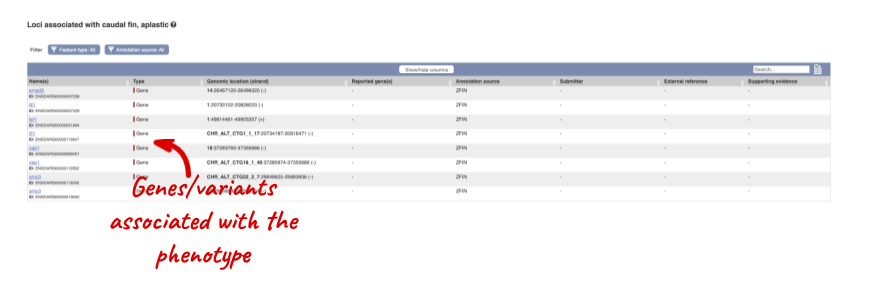
You can see other locations in the genome where any of these phenotypes have been associated. Click on caudal fin, aplastic.
Let’s have a look at variants in the Location tab. Click on the Location tab in the top bar.

Configure this page_ and open Variation from the left-hand menu.
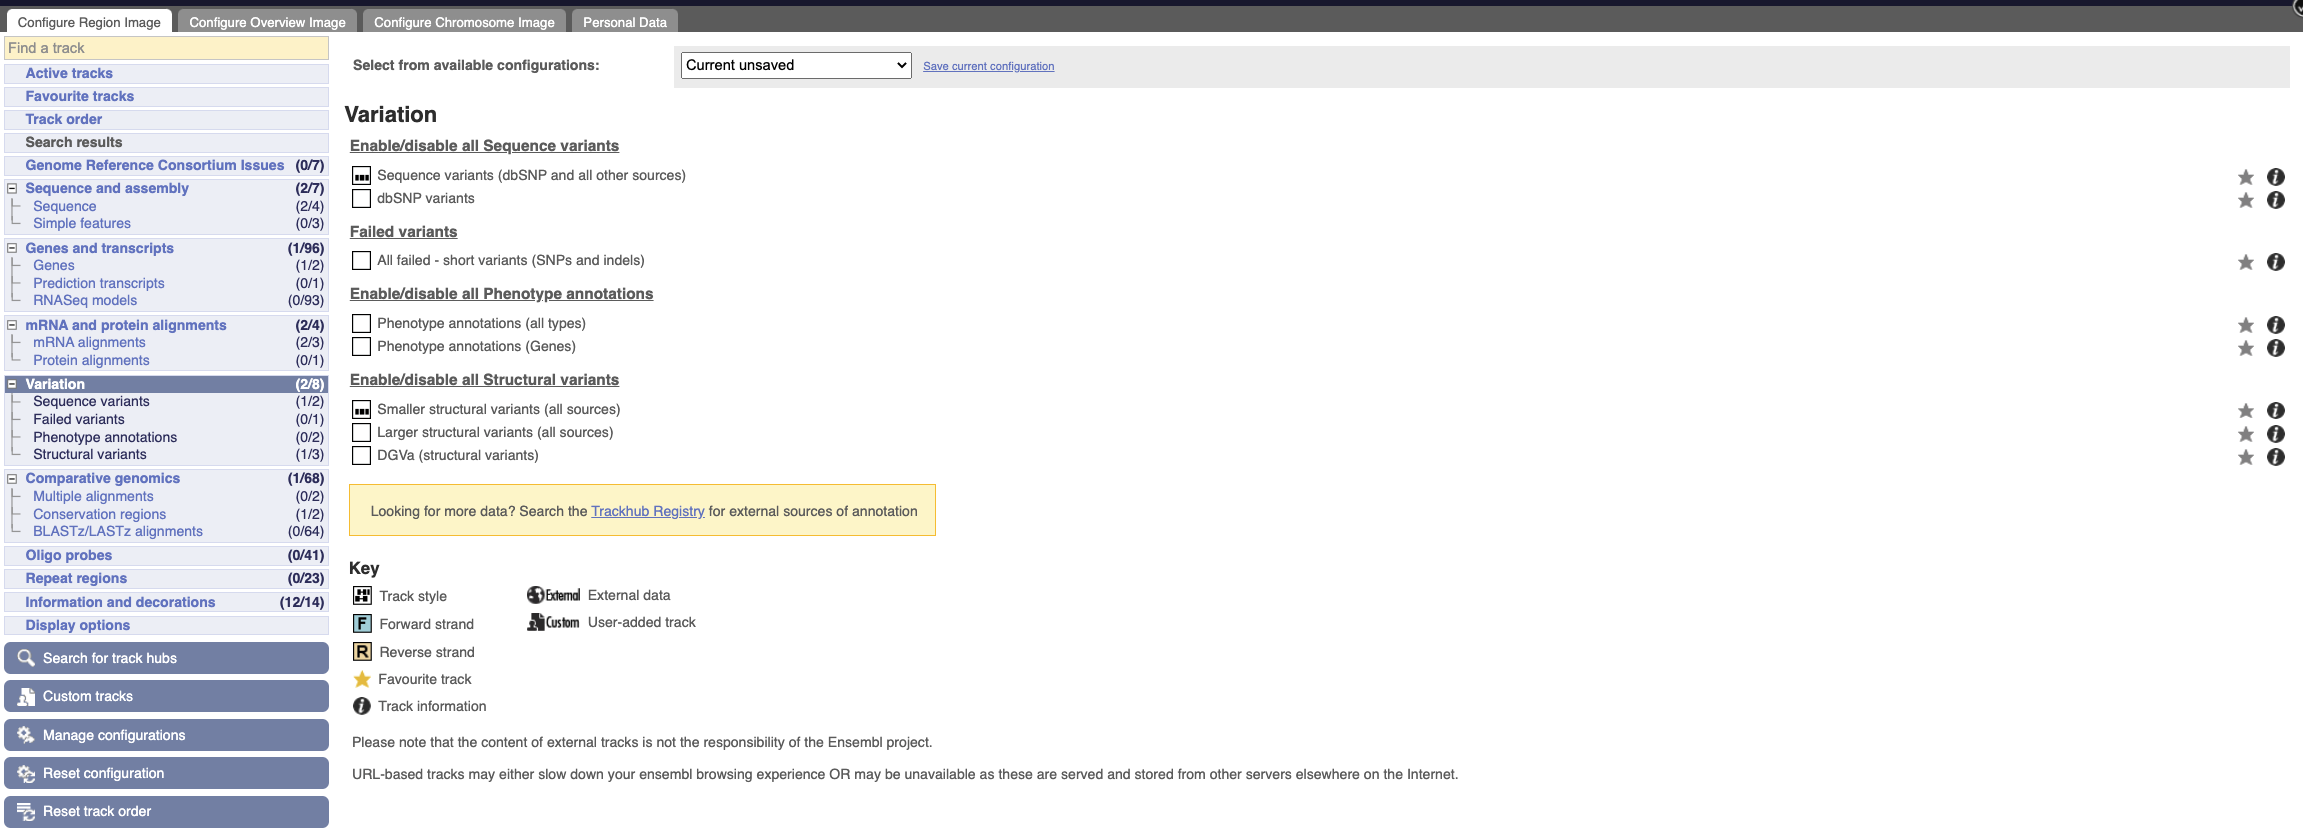
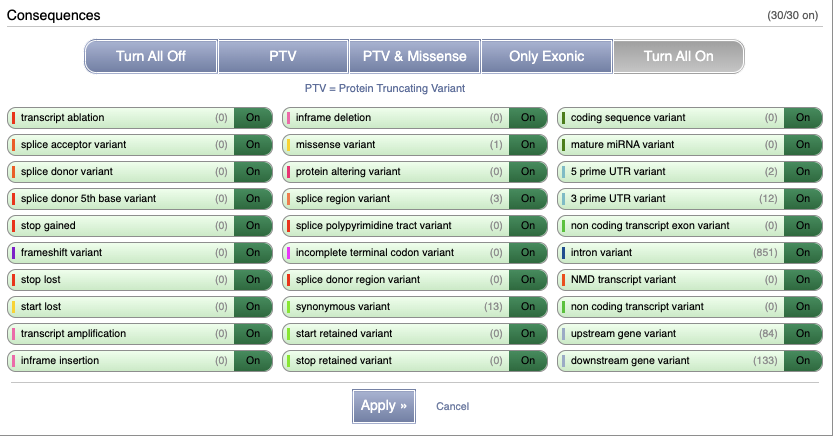
There are various options for turning on variants. Turn on the following sequence variants:
- dbSNP variants
- Phenotype annotations (all types)
- Larger Structural variants (all sources)

Click on a variant to find out more information. It may be easier to see the individual variants if you zoom in.
Let’s have a look at a specific variant. If we zoomed in we could see the variant rs180070657 in this region, however it’s easier to find if we put rs180070657 into the search box. Click through to open the Variation tab.

The icons show you what information is available for this variant. Click on Genes and regulation, or follow the link at the left.
This variant is found in two transcripts of the smc3 gene. It has not been associated with any regulatory features or motifs.
Let’s look at population genetics. Either click on Explore this variant in the left hand menu then click on the Population genetics icon, or click on Population genetics in the left-hand menu.
Exploring a SNP in zebrafish
The missense variant rs180018766 is found in the zebrafish ift88 gene.
(a) Find the page with information for rs180018766.
(b) Is rs180018766 a missense variation in all transcripts of the ift88 gene?
(c) Does the rs180018766 variant affect any other genes? If so, which genes?
(d) What is the major allele in rs180018766?
(a) Please note there is more than one way to get this answer. Either go to the Variant Table for the zebrafish ift88 gene, and filter variants to the missense variants, or search Ensembl for rs180018766 directly.
(b) Once you’re in the Variation tab, click on the Genes and regulation link or icon.
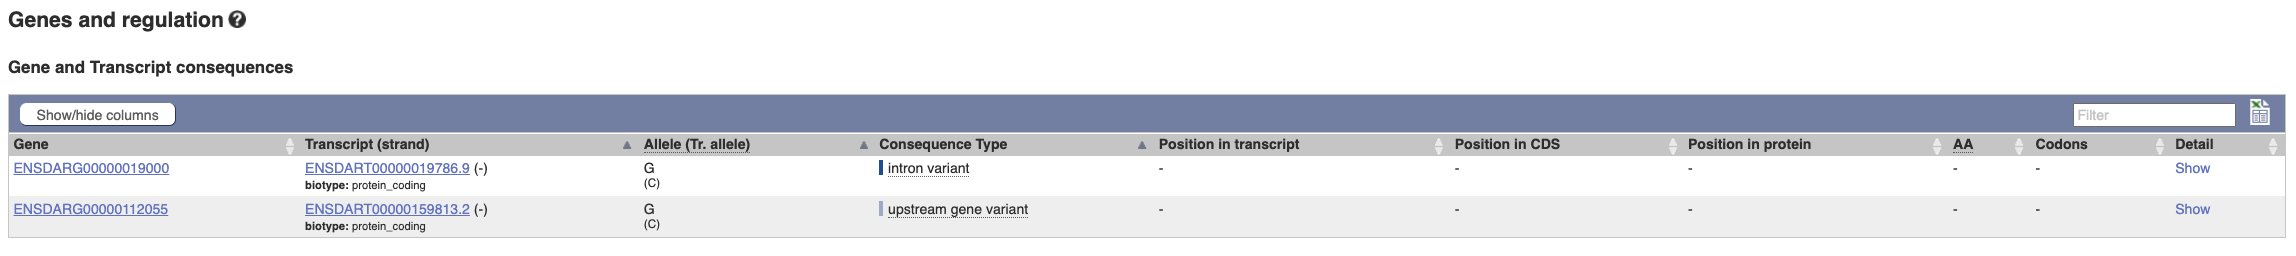
This SNP is found in six transcripts from two genes. It is a missense variant in three of these transcripts, an intron variant in two of the transcripts and an upstream variant of the last transcript.
(c) From the Genes and Transcript consequences table, you can see that rs180018766 is an upstream variant of transcript ENSDART00000018251 from the ENSDARG00000010700 (interleukin 17d) gene.
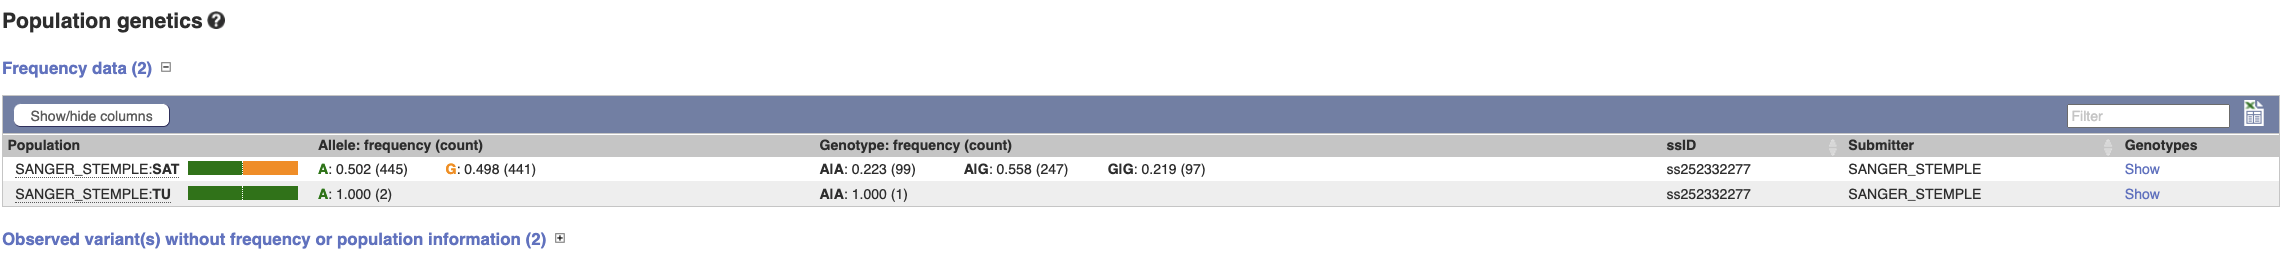
(d) Select Population genetics from the side menu.
From the Frequency data table, the Sanger Stemple submission shows that C is the major allele (50.6% of the population) compared to T (49.4% of the population). Note that T is the reference allele, irrespective of population prevalence.
Comparative genomics
Let’s look at the homologues of zebrafish brca2. Search for the gene and go to the Gene tab.
Click on Gene tree, which will display the current gene in the context of a phylogenetic tree used to determine orthologues and paralogues.
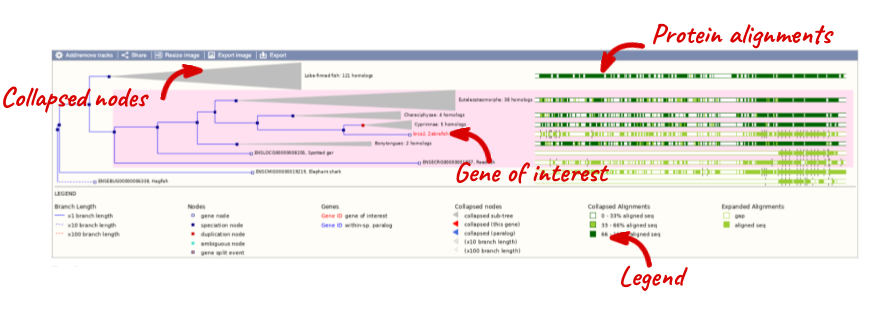
Funnels indicate collapsed nodes. We can expand them by clicking on the node and selecting Expand this sub-tree from the pop-up menu.
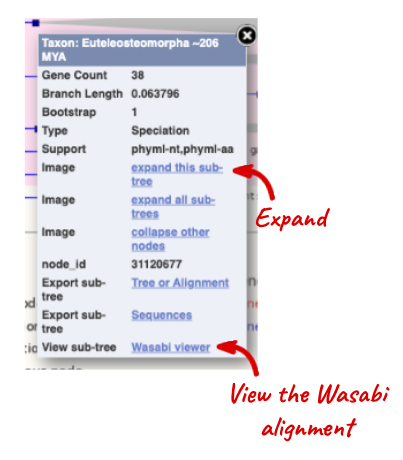
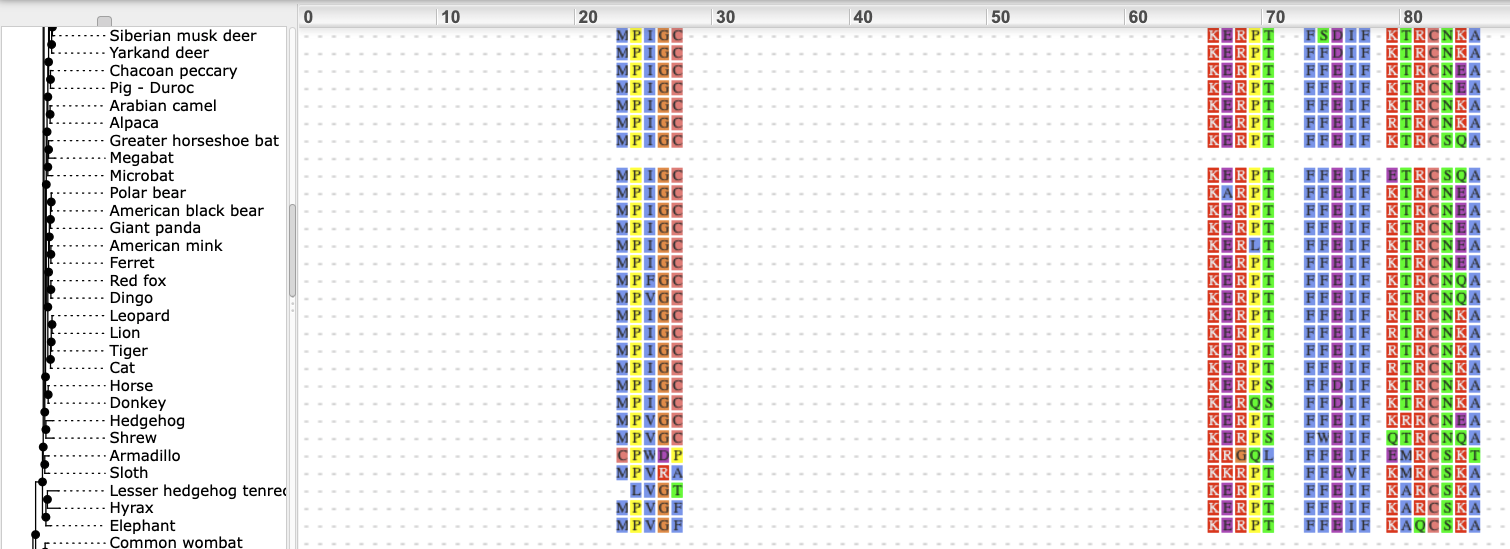
We can also see the alignment of the sub-tree by clicking on Wasabi viewer, which will open a pop-up:
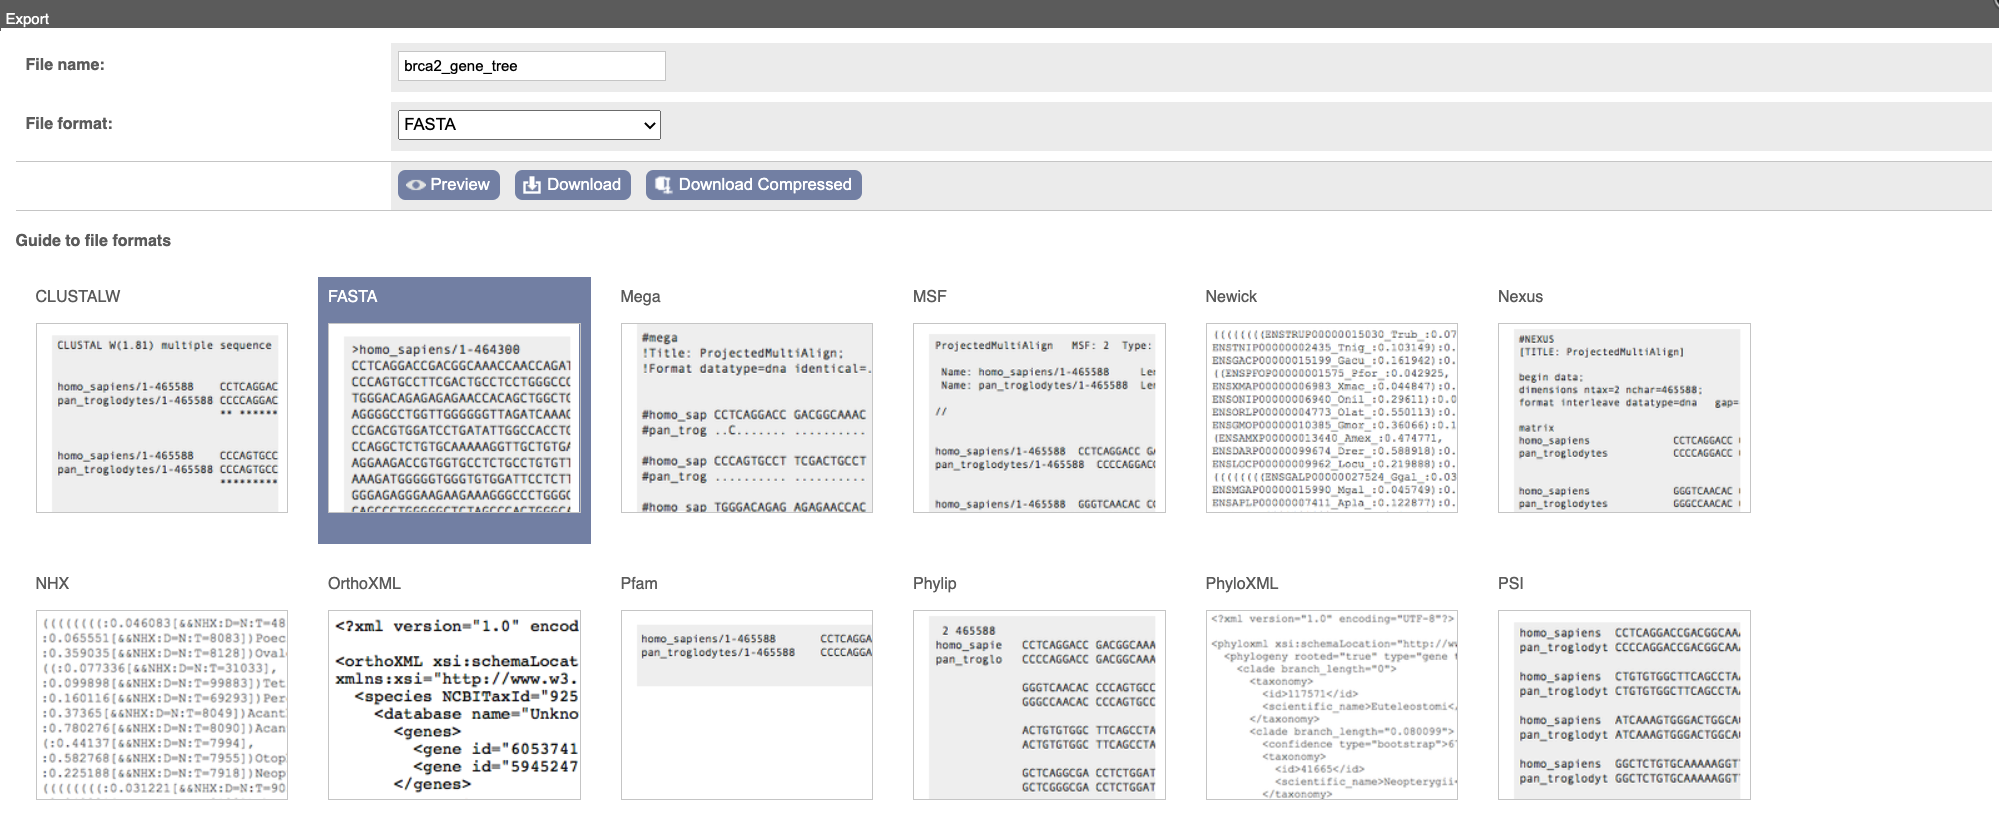
You can download the tree in a variety of formats. Click on the download icon in the bar at the top of the image to get a pop-up where you can choose your format.
We can look at homologues in the Orthologues and Paralogues pages, which can be accessed from the left-hand menu. If there are no orthologues or paralogues, then the name will be greyed out. Paralogues is greyed out for brca2 indicating that there are no paralogues available.
Click on Orthologues to see the 174 orthologues available.
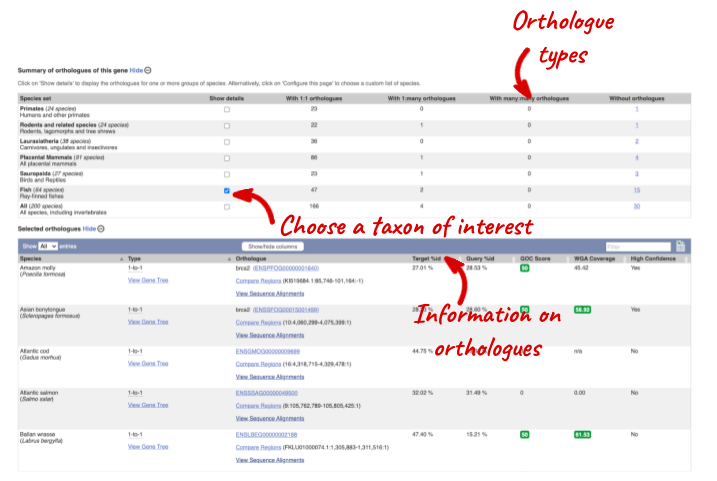
Choose to see only Fish orthologues by selecting the box. The table below will now only show details of fish orthologues. Let’s look at ballan wrasse.
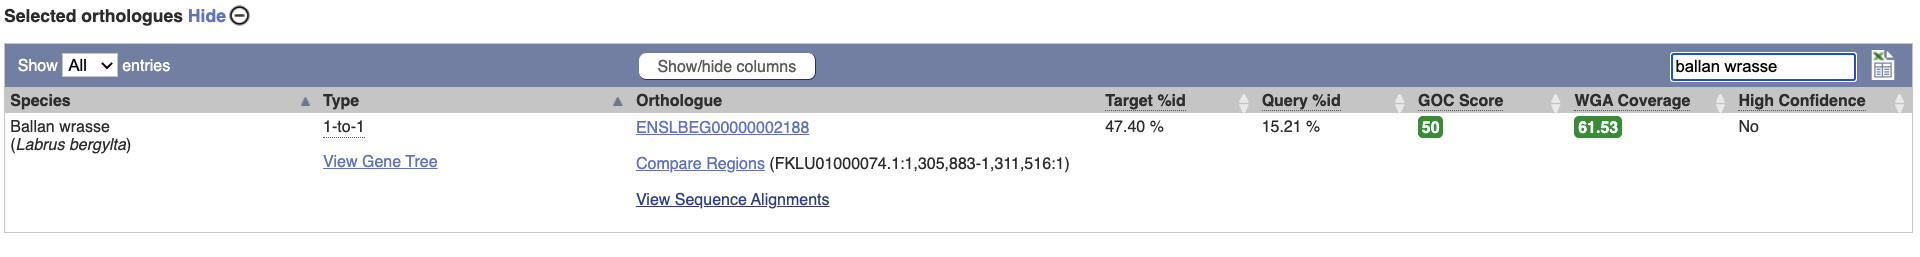
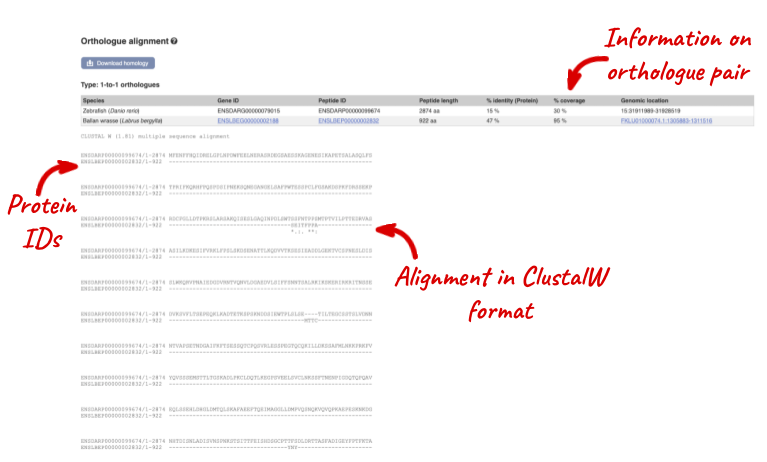
Links from the orthologue allow you to go to alignments of the orthologous proteins and cDNAs. Click on View Sequence Alignments then View Protein Alignment for the ballan wrasse orthologue.
Let’s look at some of the comparative genomics views in the Location tab. Go to the region 9:1928000-2017000 in zebrafish, which contains the hoxD cluster which is involved in limb development and is highly conserved between species.
We can look at pairwise alignment tracks in this view by clicking on Configure this page.
Select BLASTz/LASTz alignments from the left-hand menu to choose alignments between closely related species. Turn on the alignments for Chinook Salmon, Midas cichlid _ and _Sailfin molly in Normal. Save and close the menu.
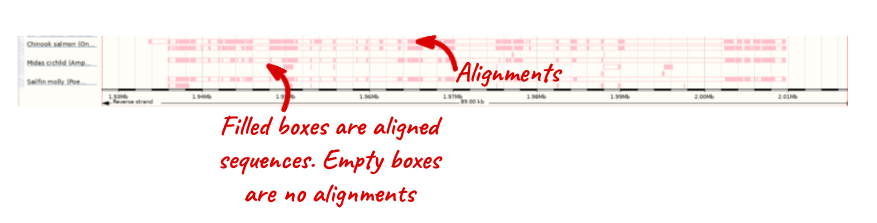
The alignment is greatest between closely related species.
We can also look at the alignment between species or groups of species as text. Click on Alignments (text) in the left hand menu.
Select Select an alignment to open the alignment menu.
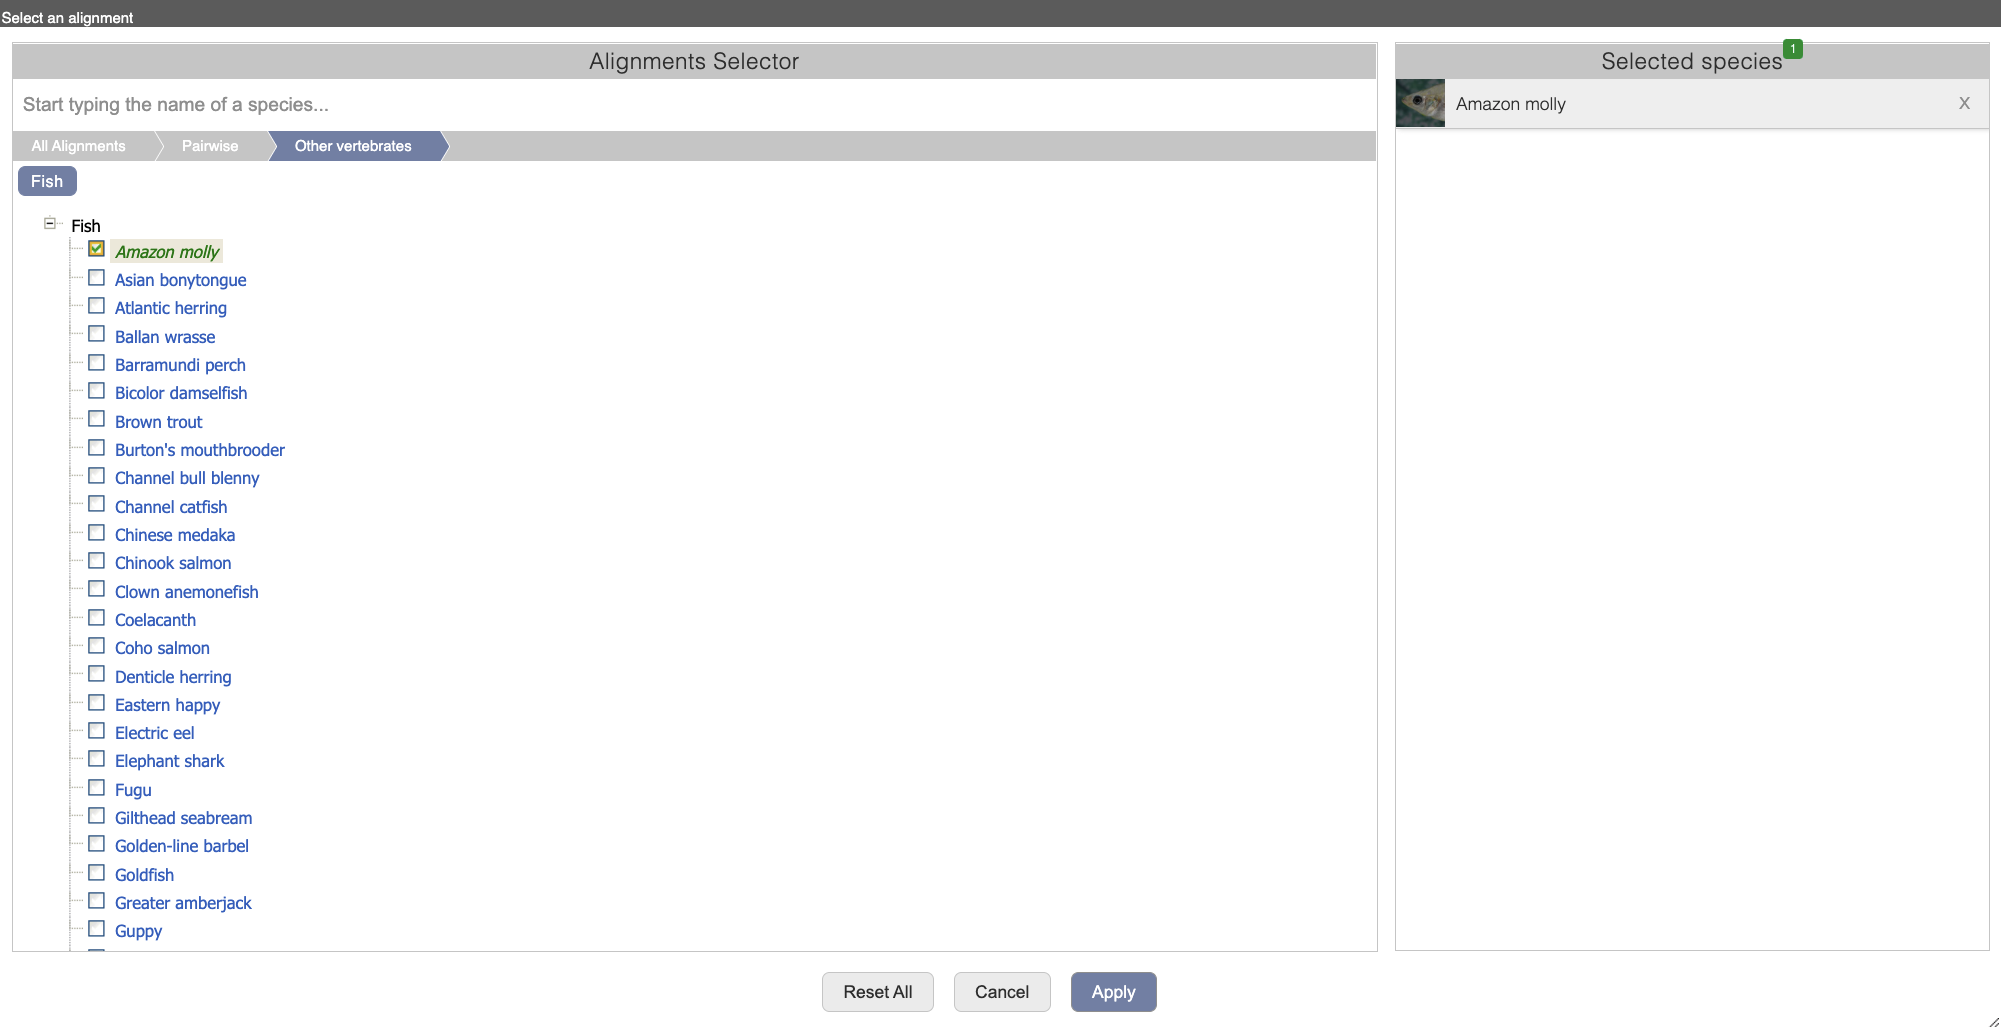
Click through the links, Pairwise, Other vertebrates, Fish to select Amazon molly.
In this case there are nine blocks aligned, Block 1 a large (73775 bp) alignment against Amazon molly scaffold KI519626.1 and four smaller blocks. Click on Block 1.
You will see a list of the regions aligned, followed by the sequence alignment. Exons are shown in red.
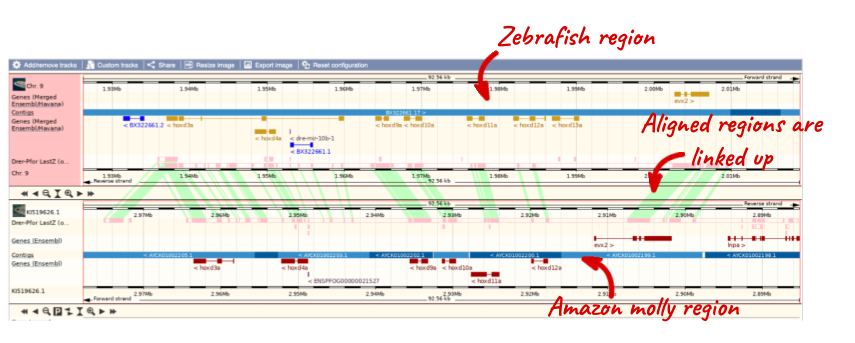
To compare with both contigs visually, go to Region comparison.
To add species to this view, click on the blue Select species or regions button. Choose Amazon molly again then close the menu.
You can configure this view for both species. Click on Configure this page and look in the top left of the menu.

The drop down allows you to configure each species separately.
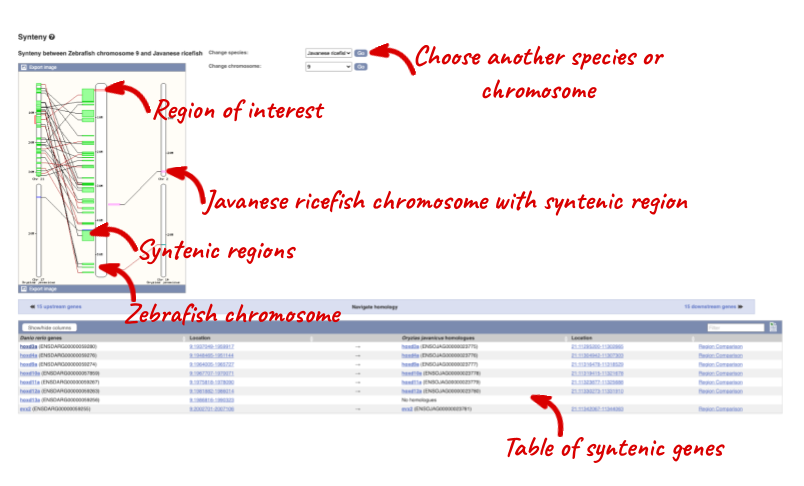
We can view large scale syntenic regions from our chromosome of interest. Click on Synteny in the left hand menu and select Javanese ricefish.
Orthologues and gene trees for the zebrafish braf gene.
(a) How many orthologues are predicted for this gene in fish?
(b) How much sequence identity does the guppy protein have to the zebrafish one? Click on the Alignment link next to the Ensembl identifier column to view a protein alignment in Clustal format.
(c) Go to the gene tree for this gene. What are the closest genes to zebrafish braf in this gene tree?
(a) Go to www.ensembl.org, choose Zebrafish and search for braf. Click through to the Gene tab view.
On the gene tab, click on Orthologues at the left side of the page to see all the orthologous genes. There are 1:1 orthologues in 52 fish, 1:many orthologues in 10 fish and 2 fish with no orthologues.
(b) The percentage of identical amino acids in the guppy protein (the orthologue) compared with the gene of interest. i.e. zebrafish braf (the target species/gene) is 88.6%. This is known as the Target %ID. The identity of the gene of interest (zebrafish braf) when compared with the orthologue (guppy braf, the query species/gene) is 84.7% (the query %ID).
Note the difference in the values of the Target and Query % ID reflects the different protein lengths for the zebrafish and guppy braf genes.
(c) Click on Gene tree in the left hand menu. The closest genes in the tree to zebrafish braf are found in a collapsed node labelled Characiphysae. Click on the node to get a pop-up, then expand this subtree to see the genes. The five genes closest to zebrafish braf are Mexican tetra, red-bellied piranha, electric eel and channel catfish.
Zebrafish alignments
Go to www.ensembl.org to find the slc24a5 gene on the zebrafish genome.
(a) Go to the Location page for this gene. View the Alignments (image) and Alignments (text) for the channel catfish.
(b) Export the alignment (as ClustalW).
(a) Start in the Location tab (region in detail) for slc24a5. Click on Alignments (Image) at the left, and select the channel catfish pairwise alignment from the species selector.
(b) You can export the alignments from either the Alignments (text) or Alignments (image) pages in the Location tab. Click on the blue Download alignments button at the top of the text page, or the icon at the top of the image, and choose ClustalW from the list.
Zebrafish Synteny
Go to www.ensembl.org Find the Rhodopsin (rho) gene for zebrafish. Go to the Location tab.
(a) Click Synteny at the left. Are there any syntenic regions in Japanese medaka HdrR If so, which chromosomes are shown in this view?
(b) Stay in the Synteny view. Is there a homologue in Japanese medaka HdrR for zebrafish rho? Are there more genes in this syntenic block with homologues?
(a) Change the species to Japanese medaka HdrR next to the image. Yes, there are multiple syntenic regions in Japanese Medaka to zebrafish chromosome 8, which is in the centre of this view. Japanese medaka HdrR chromosomes 4, 7, 9, and 12 have syntenic regions to zebrafish chromosome 8.
(b) Scroll down to the bottom of the page. There is a homologue in Japanese medaka HdrR of zebrafish rho. Click 15 upstream genes or 9 downstream genes to compare the genes between zebrafish and Japanese medaka HdrR in this syntenic block.
Biomart
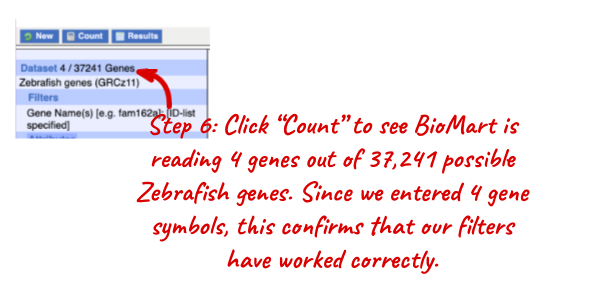
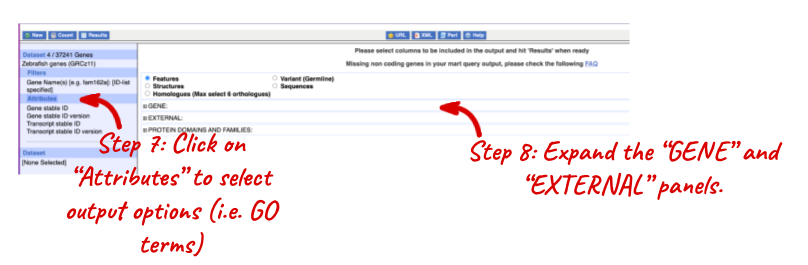
Follow these instructions to guide you through BioMart to answer the following query: You have three questions about a set of zebrafish genes: espn, slc24a5, cisd2, thrb
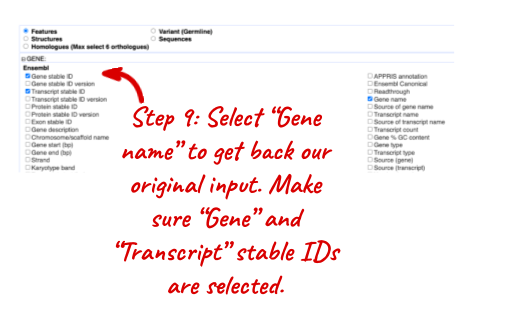
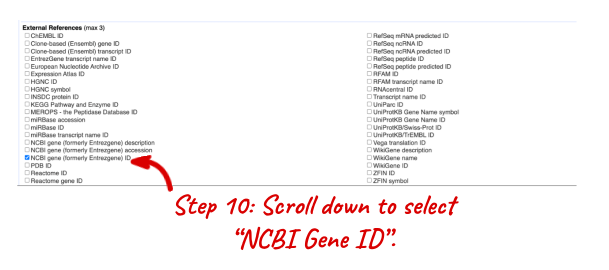
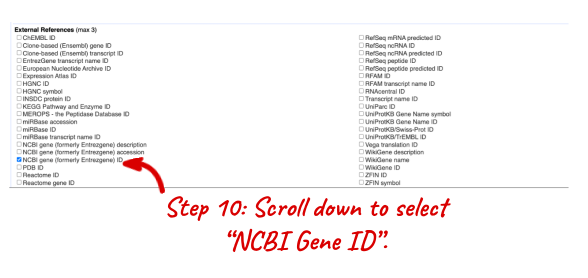
1) What are the NCBI Gene IDs for these genes?
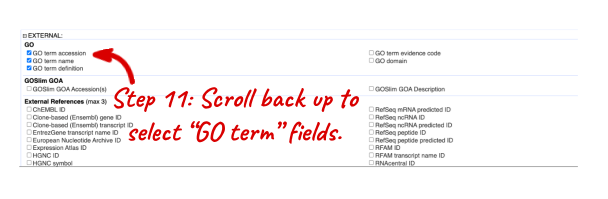
2) Are there associated functions from the GO (gene ontology) project that might help describe their function?
3) What are their cDNA sequences?
Step 1: Click on BioMart in the top header of a www.ensembl.org page to go to: www.ensembl.org/biomart/martview
NOTE: These answers were determined using BioMart Ensembl 107. 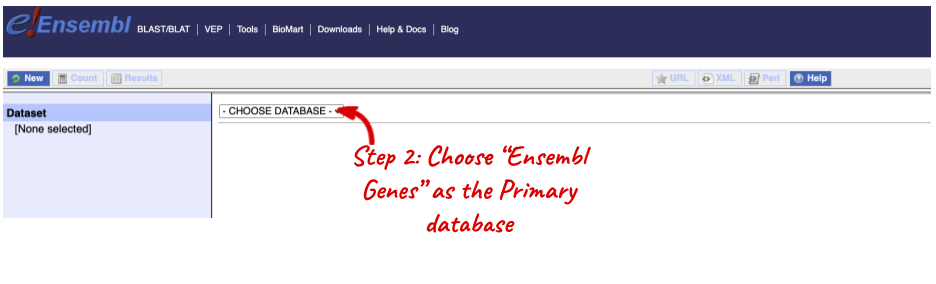
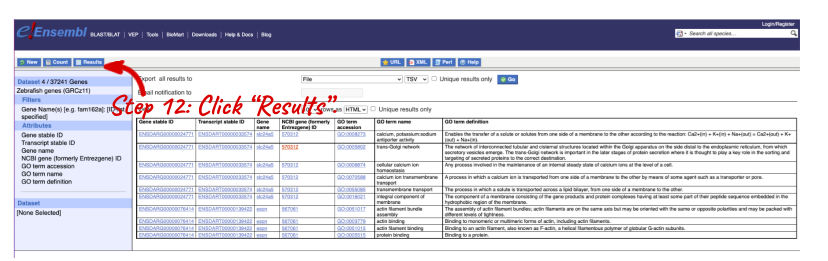
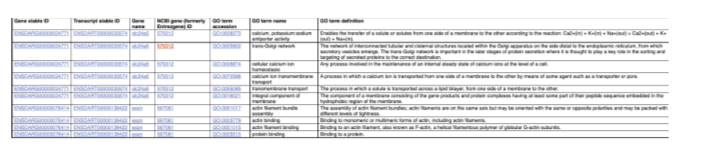
NOTE: You can use the Go button to export a file.
What did you learn about the zebrafish genes in this exercise? Could you learn these things from the Ensembl browser? Would it take longer?
For more details on BioMart, have a look at this publications:
Kinsella, R.J. et al Ensembl BioMarts: a hub for data retrieval across taxonomic space. http://europepmc.org/articles/PMC3170168
Finding genes by protein domain
Find zebrafish proteins with Transmembrane helices located on chromosome 9.
As with all BioMart queries you must select the dataset, set your filters (input) and define your attributes (desired output). For this exercise: Dataset: Ensembl genes in zebrafish Filters: Transmembrane helices on chromosome 9 Attributes: Ensembl gene and transcript IDs and gene name
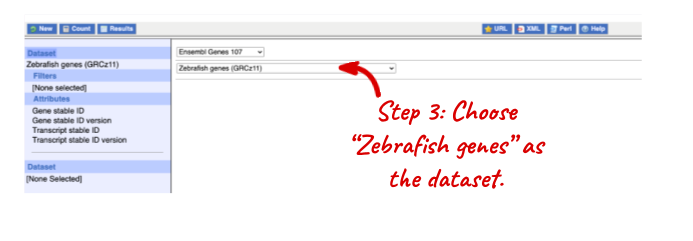
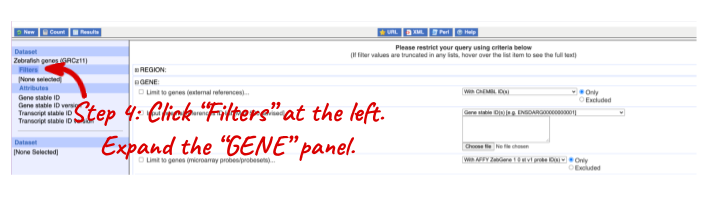
Go to the Ensembl homepage (http://www.ensembl.org) and click on BioMart at the top of the page. Select Ensembl Genes as your database and Zebrafish genes as the dataset. Click on Filters on the left of the screen and expand REGION. Change the Chromosome to 9.
Now expand PROTEIN DOMAINS AND FAMILIES, also under filters, and select Limit to genes, choosing With Transmembrane helices ID(s) from the drop-down and then Only. Clicking on Count should reveal that you have filtered the dataset down to 238 genes.
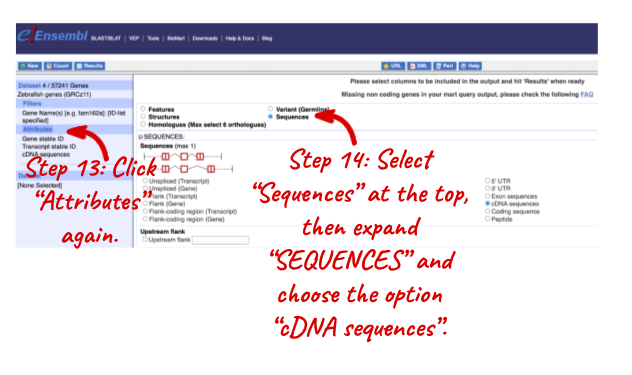
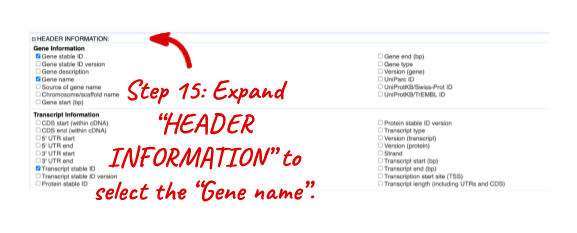
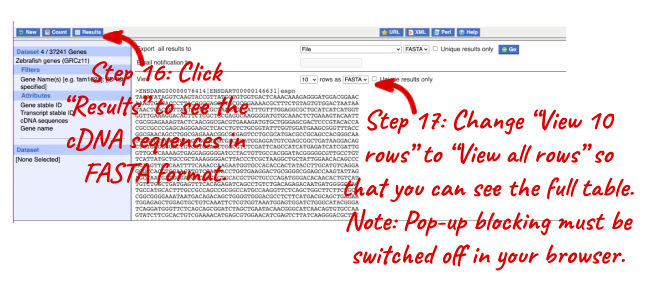
Click on Attributes and expand GENE. Select Gene name. Now click on Results. The first 10 results are displayed by default; display all results by selecting ALL from the drop down menu.
The output will display the Ensembl gene ID, Ensembl Transcript ID and gene names of all proteins with Transmembrane helices on zebrafish chromosome 9. If you prefer, you can also export as an Excel sheet by using the Export all results to XLS option.
Export homologues
For a list of Gasterosteus aculeatus (stickleback) Ensembl genes, export the zebrafish orthologues.
ENSGACG00000000006 ENSGACG00000000009 ENSGACG00000000011 ENSGACG00000000013 ENSGACG00000000017 ENSGACG00000000022
Click New. Choose the Ensembl Genes database. Choose the Stickleback genes (BROAD S1) dataset.
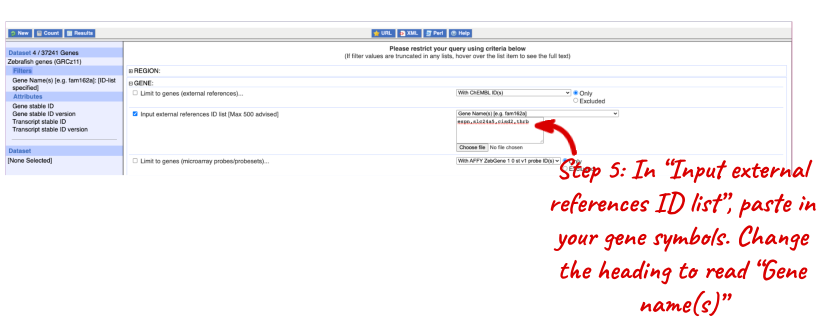
Click on Filters in the left panel. Expand the GENE section by clicking on the + box. Enter the gene list in the Input external references ID list - Gene stable ID(s) box.
Click on Attributes in the left panel. Select the Homologues attributes page. Expand the Orthologues section by clicking on the + box. Select Zebrafish gene stable ID. Click Results.
Zebrafish Export structural variants
You can use BioMart to query variants, not just genes. (Make sure you use the right Datasets)
Export the study accession, source name, chromosome, sequence region start and end (in bp) of zebrafish structural variations (SV) on chromosome 1, starting at 10,000,000 and ending at 50,000,000.
Choose Ensembl Variation and Zebrafish Structural Variants. Filters: REGION: Chromosome 1 Coordinates: Start: 10000000 End: 50000000 Count shows 159 out of 5735 structural variants. Attributes: Structural Variant (SV) Informations: Study accession and Source name Structural Variant (SV) Location: Chromosome/scaffold name, Chromosome/scaffold position start (bp) and Chromosome/scaffold position end (bp).
Exporting paralogues with BioMart
Export a list of all zebrafish genes on chromosome 14 which have a paralogue, including the gene names, the last common ancestor and the identity between the genes.
Start at ensembl.org/biomart/martview. Choose the Ensembl Genes database. Choose the Zebrafish genes dataset.
Click on Filters in the left panel. Under REGION: select Chromosome – 14. Under MULTI SPECIES COMPARISONS: select Homologue filters – Paralogous Zebrafish Genes: Only.
Click on Attributes in the left panel. Select Homologues from the six options at the top. Under GENE: deselect Ensembl Transcript stable ID and its version, select Gene name. Under PARALOGUES: select Zebrafish paralogue gene stable ID, Zebrafish paralogue associated gene name, Paralogue last common ancestor with Zebrafish, Paralogue %id. target Zebrafish gene identical to query gene and Paralogue %id. query gene identical to target Zebrafish gene.
Click the Results button on the toolbar. Select View All rows as HTML or export all results to a file.


